How do I start? Profitable Trading
day trading Strategy, day trade signals, pivot point, moving average trading, pivot point calculations
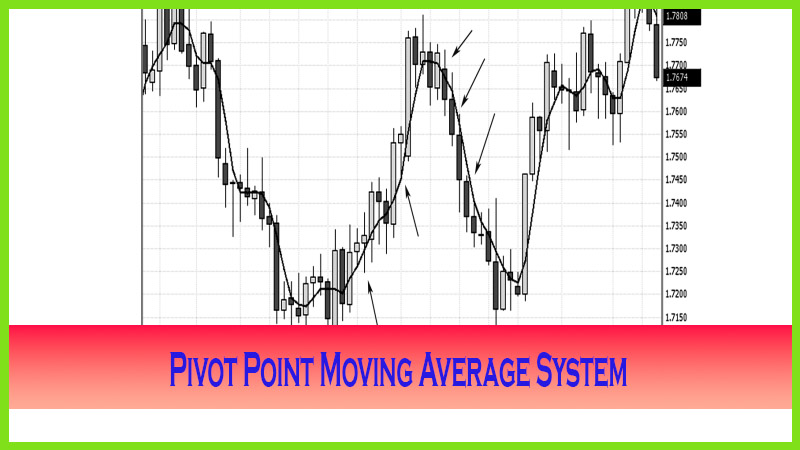
Course: [ The Candlestick and Pivot Point Trading Triggers : Chapter 6. Pivot Point Moving Average System ]
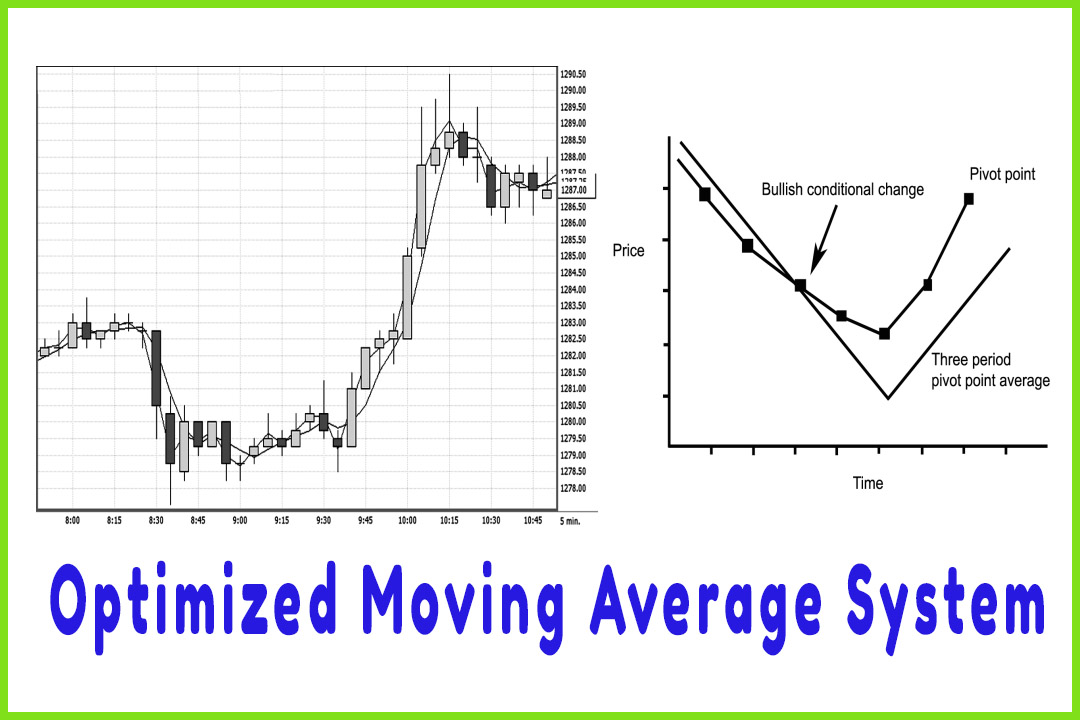
Using the pivot point as a moving average in addition to using the pivot point calculations to identify target ranges will certainly make you a more prepared trader.
HOW DO I START?
First,
I need to structure my computer and my charts to a format that is conducive to
day trading. For stock index contracts, I watch two “like” or “tandem” markets in two time periods. These are the CBOT mini-Dow and
the e-mini-S&P. Lately, due to client requests, I have been alerted to
trading the Russell 2000 and the German stock index Deutscher Aktien Index,
known as the DAX. The DAX, an index portfolio of 30 German blue-chip stocks,
opens at 3 a.m. (ET) and closes at 11 a.m. (ET). (On a side note, as of October
2006, the DAX, based in Frankfurt, Germany, will start accepting non-German
companies. In order to qualify for the Index, foreign companies must conduct
their operations in Germany.) The DAX 30 actually tracks close to moves in the
S&P 500 futures. In spot forex, I use the euro and a like market, such as
the British pound and the yen.
For day
trading, I use the 5- and 15-minute time periods. All of my chart screens look
the same: The 5-minute e-mini-S&P and the mini-Dow are on the top, and the
15-minute S&P and mini-Dow are on the bottom. All my chart pages are set up
this way; therefore, all chart pages are synchronized so that I do not watch
different time periods when switching from one screen to another—I have a
uniform setting.
- I find the most reliable day trade signals are confirmed in the 15-minute time frame and triggered in the 5-minute time period as well.
- When both time frames are in sync with each other and when like markets have similar signals, this generates a higher probability trigger.
As I
stated earlier, the parameters I use in this book are a variation of what is
programmed in my proprietary library with Genesis Software. This is a system
that generates buy and sell signals based on the principles we have gone over
in the book so far. More information on this software can be found on my web
site at www.nationalfutures.com
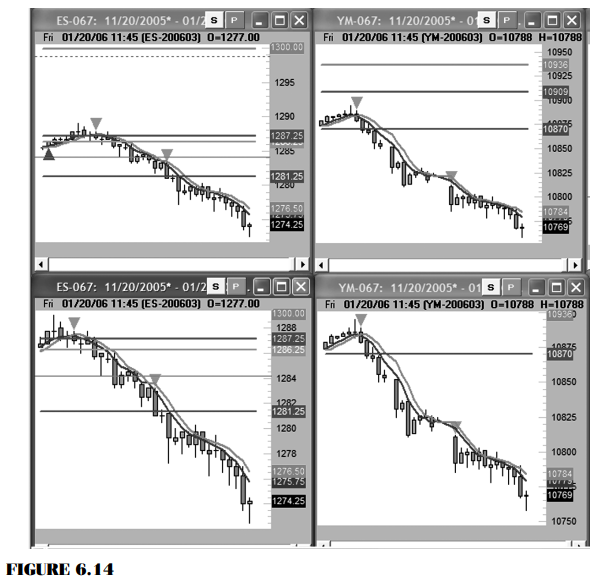
Figure
6.14 illustrates how I line up the e-mini-S&P with the mini-Dow side by
side with the corresponding time periods of 5 minutes at the top and 15 minutes
at the bottom. Stock and forex charts are lined up the same way.
The greatest feature with this software
is that it highlights a sell signal with a red triangle pointing down, and it
signals a buy trigger with a green triangle pointing up. These coincide against
resistance levels to sell and support levels to buy. As you can see, the sell
signals when aligned against the pivot point resistance numbers offer a
fantastic visual confirmation based on my predefined strategies; therefore, it
will help eliminate the emotional element and impatience of acting on
anticipation rather than on a true signal.
All the
signals and methods covered in this book can be applied with most charting
packages. In fact, 26 years ago, I was calculating the pivot point support and
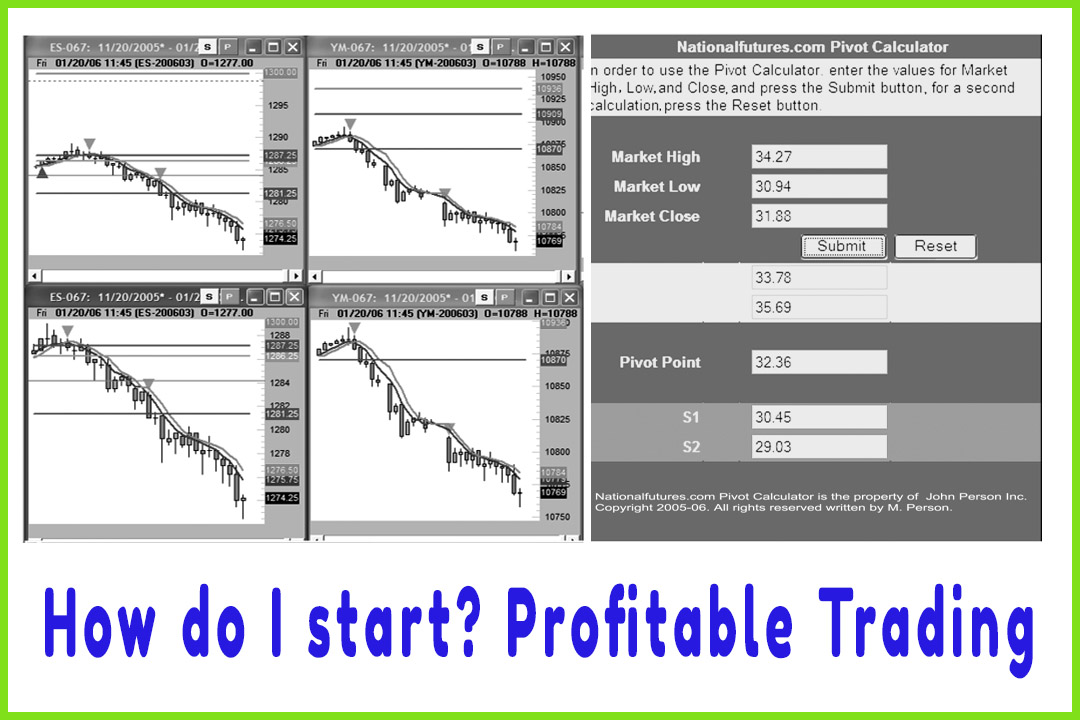
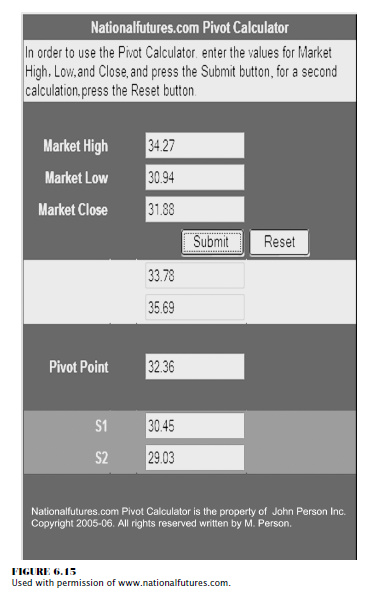
resistance numbers with a handheld calculator. The pivot point calculator is
available on my web site. In addition, this book comes with a CD (compact disc)
that has a pivot point calculator as well. All that needs to be done is to
input the data for the high, the low, and the close; and the R-2 down to the
S-2 numbers will be calculated for you. It is very easy to use; all you need
are the prices for stocks, futures, or forex markets for any time frame. Figure
6.15 shows the monthly price range for Dell Inc., which I will use to
demonstrate how powerful this method of market analysis is when combined with
certain candlestick patterns.
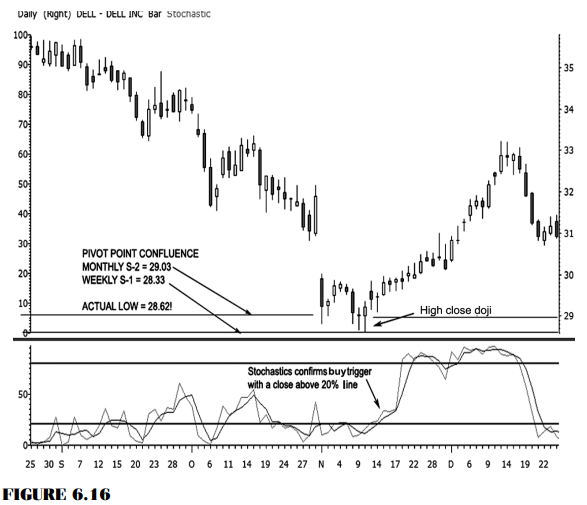
Figure
6.16 is Dell with the monthly and weekly pivot support targets indicating a
possible bottom. Using the higher time frames, such as the monthly figures,
alerted me to a major bottom. All I then needed to do was a high close doji pattern.
The next few chapters will really bring home the message of the value of incorporating pivot points and candlestick patterns. Using the pivot point as a moving average in addition to using the pivot point calculations to identify target ranges will certainly make you a more prepared trader.
This method has captured the attention of
many experts who are now using it; and its accuracy at predicting turning
points in the market constantly amazes me. Believe me, many people are
fascinated by this concept. In December 2002, Futures Magazine first
published an article I wrote on the subject, “Combining Cycles and Pivot Points
to Predict Market Values” (p. 38), and has published several other articles of
mine. Perry Kaufman, the famous technician and author, in the fourth edition of
his nearly 1,200-page New
Trading Systems and Methods (Wiley, 2005) quoted my work from such magazine
articles.
Many other educators have come to
listen to me teach, have taught my ideas, and have seen improvement in their
students. I have had the opportunity to share my work and research with others,
and I would like to share it with you. These trading ideas are not new, and
they have stood the test of time.
Here is
an excerpt from an online interview I had in February 2003 (see www.nationalfutures.com).
The concepts I was talking about then pretty much cover what we have gone over
so far and will continue to cover in the following chapters. The difference is
that I am going over in detail what the specific signals, settings, and rules
are for the trading triggers.
Q: How do you calculate pivot points?
A: I use the traditional formula. To determine current
support/resistance levels, the first step is to find the pivot point [PP]
number: PP = (H + L + C) divided by 3
The first
resistance level (R-1) = (PP x 2) - L
The
second resistance level (R-2) = PP + H - L
The first
support level (S-1) = (PP x 2) - H
The
second support level (S-2) = PP - H + L
Q: What time frames do you apply to calculate the pivot
points?
A: I find it extremely important to use multiple time frames
in my research and analysis. For those who are familiar with the “numbers” from
the pivot point calculations, the idea of applying them from any time period
other than the prior day’s session may make little or no sense. However, I
apply the daily, weekly, and even monthly target numbers and incorporate these
in my traders “tool box.” Often traders will comment, “If I am a day trader, why would I want to
be concerned with a monthly or a weekly market outlook?” Consider that in every month, there will be a
high and a low, and the close will be somewhere in between. In one week, a high
or a low will be established; and in one day of the week, the market will form
that point of interest. More often than not, in an hour or so, trades will take
place that will establish that high and subsequently that low!
Q: What are the various time periods in forex markets from
which you take the data to calculate the numbers?
A: For the daily numbers, I take the New York Bank settlement.
For weekly numbers, I use the data beginning from the open on Sunday night to
the close on Friday afternoon. Monthly numbers are calculated by calendar
periods.
Q: What is the main purpose for using the pivot points, and
how can traders use them?
A: One popular application of the pivot point concept is to go
long or cover any short positions at either of the two support levels or to go
short or sell at the projected resistance levels. Knowing these fixed price
levels gives the trader unambiguous points to trade off, to enter, or to exit
the market or, more important at times, where not to enter a position. For example,
you should not buy right at either of the resistance levels. These levels act
as boundaries that can turn back price advances or declines, at least on the
first attempt. Another technique is to trade the breakout of the first support
or resistance levels. If prices do break through the S-1 or R-1 level, traders
have a new target at the R-2 or S-2 level to take profits. The benefits of
using the both short- and longer-term pivot points for a short-term day trader
are numerous: They give a trader a better edge due to the ability to work with
predetermined price levels, which lead to precise entry and stop loss points,
all of which give the trader the additional edge in the quest for bigger
profits.
Q: You use different technical tools in your daily videos. On
which ones do you put more trust or emphasis?
A: Great question! I use stochastics as an overbought/oversold
indicator, and I use it to help me determine divergence and convergence
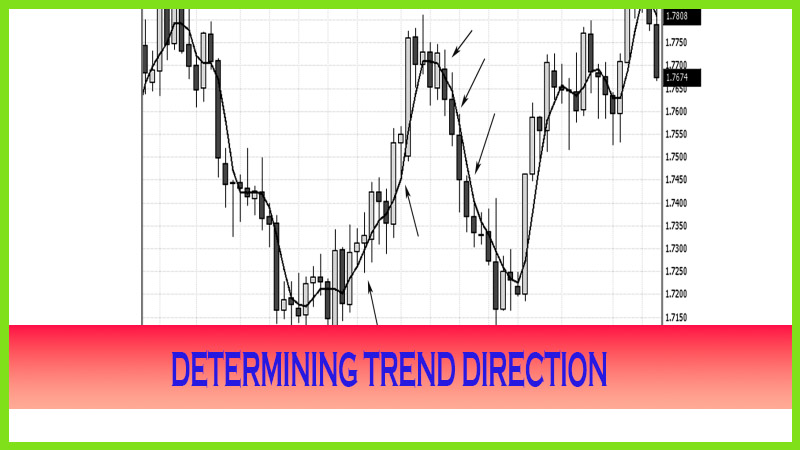
signals. I use three-period variable moving averages to help keep me focused on
the trend. Moving averages also help me identify potential turning points when
the short-term average crosses over or below the longer-term average.
Q: You use candle charts over bar charts. Why is that?
A: Each candle has different characteristics that represent
the difference, or the distance, between the high, the low, the open, and the
close. These characteristics use colors to differentiate the relationship
between the open and the close, referred to as the real body. Candlestick
charting acts as an immediate way to illustrate and to help identify the
current market’s environment and the current time frame’s acceptance or
rejection of a specific support or resistance level in a clear visual manner.
If, for example, on a given trading session, prices move higher from the
opening price, establish the high, and then fall, the distance formed from
those points of interest is called the “shadow.”
Candle
charts give me color and depth, which help me almost immediately determine
where current prices are in relation to past price levels. Candlestick charting
techniques can be used from data for whatever time period you are looking at:
hourly, daily, weekly, or monthly. There are 60 to 70 different classifications
of named candlestick patterns—from one on up to several candle components. They
can signal reversal, stalled, and continuations of a market’s price move. Day
traders want to focus on a small arsenal of the more consistent and reliable
reoccurring formations. Several patterns that a trader wants to home in on and
recognize are the more powerful reversal formations at tops and bottoms of
price ranges.
Q: How do candlesticks help you in your trading?
A: My trading approach incorporates time-tested techniques but
uses the aid of candlestick charts, which help me identify the true condition
of the markets. If you believe market prices are simply the reflection of human
emotion on perceived current value and focus on what the market is doing,
rather than on what the market might do, then you are ahead of the crowd in
understand how markets function. With that understanding, you will then be able
to have the confidence to act swiftly and to execute or trigger into a trade or
position in the market.
Q: Which do you favor more—fundamental or technical analysis?
A: I watch what reports are coming out, as some can generate
wild gyrations (e.g., monthly unemployment report). I rely heavily on technical
analysis. After all, it is the purest and most objective study of price action.
It is used for expedience. You can review one, five, ten, or even twenty charts
in a matter of seconds or minutes to get a quick overview of the general
trends. How long would it take to study the fundamental reports on the economy
or interest rates in various countries to develop an opinion to buy or sell a
foreign currency? That process could take hours, days, or even weeks to figure
out. Specific chart patterns and price actions have a high degree of
repetition. They are not 100 percent accurate; however, they do have a high
percentage of reoccurrences. Success comes in the simple form of managing risk
when applying a systematic method to these principles and being able to quickly
identify when and why a particular pattern fails.
Q: You learned that certain candle patterns developed near
these pivot points. Which ones do you look for near support or resistance
levels?
A: Top reversal or bearish, such as dojis, bearish haramis,
harami crosses, dark cloud covers, and evening star formations. And for bottom
reversal or bullish candle patterns, I look for bullish haramis, harami
crosses, bullish piercing patterns, bullish engulfing patterns, or, my
favorite, a rare occurring pattern called a morning doji star.
Q: How significant are doji patterns?
A: Extremely significant, especially if you know what to look
for. There are specific criteria that dojis need to meet; but if you know what
these are, they can be very powerful in helping your trading decisions. Doji
formations help confirm reversals. There are different names and nuances
associated with certain dojis. Dojis indicate indecision, the market ends or
closes, where it began or opened. Dojis signify that confidence is lost from
buyers or sellers after the open as the market made a lot of intraday noise as
the range during the day was established. In a bullish or bearish trending
market, indecision is the last thing you want to see. Strong rejection or
failure from the high and/or the low is a significant telltale sign that
changes are coming.
Q: What other considerations can you share with us regarding
dojis?
A: In a strong up-trending market, usually the market will
close near a high, as larger capitalized traders will hold positions overnight.
If the large money traders are not confident the market will move higher in
price, then usually the market closes back near the open. I find it uncanny how
many times dojis form at or very close to the actual pivot point calculated
support or resistance numbers. That is what helps me set up my trades; it is
the relation of the next candle’s close after a doji that triggers my entries,
especially if they are lined up at the pivot points.
Q: What is the shortest time frame that you use for charting?
A: Five minutes.
Q: What other time frames do you track?
A: Besides monthly, weekly, and daily charts, I use the 5-,
the 15-, and the 30-minute and even the 60-minute for overnight trend trading.
Q: What is your favorite or most reliable time frame?
A: For day trading, the 5- and 15-minute are equally
important; so I watch both.
Q: Do you just use pivot points, or do you use other methods
for forecasting support and resistance levels?
A: In my book A Complete Guide to Technical Trading Tactics:
How to Profit Using Pivot Points, Candlesticks, and Other Indicators, I
demonstrate many powerful ways to anticipate support and resistance levels,
including Fibonacci retracement, Fibonacci extensions, and projection methods.
In fact, in my trading course, I teach specific trade setups and confirm
signals to trigger or execute trades, how to manage a trade, and how to know
when to exit or even reverse a position.
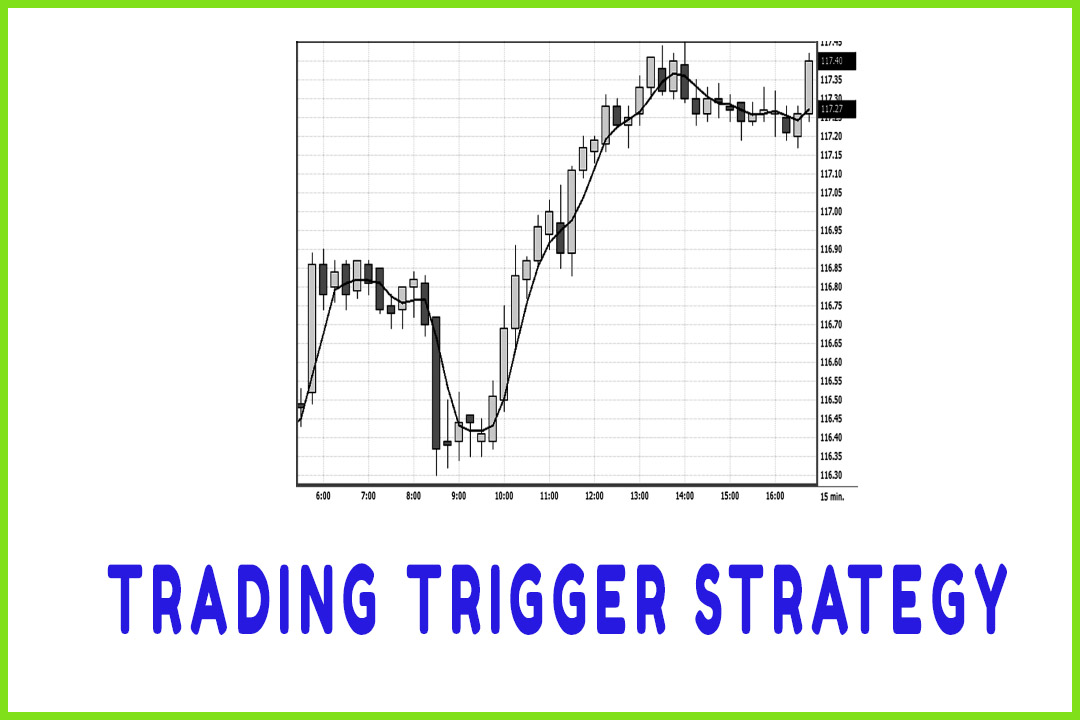
Q: What signals or rules do you follow for a trading trigger?
A: Without giving away too many of my trade secrets, there is
one that can be found in my advanced trading course—a special trading setup
that I look for in a bullish setup.
- When the market approaches a key pivot point, buy on the close or on the next open once a new closing high is made above the previous bullish reversal candle pattern or a doji.
- Place your initial risk-management stop below the low of the lowest low point of the bullish candle pattern on a stop-close-only basis.
- Exit the trade on the close or on the first open of a candle that makes a lower low after a prolonged uptrend, especially if it is near a pivot line.
- One can use a “filter,” or a back-up process, to confirm the buy signal against a major pivot point number, such as a bullish convergence stochastic pattern.
Remember,
a bullish candle pattern can be a harami, a harami doji cross, a bullish
piercing pattern, a bullish engulfing pattern, a doji, or a morning doji star.
Q: Tell us about this course and book you have mentioned?
A: The book was published by John Wiley and Sons in May of
2004. I put the course together based on several seminars I conducted, one of
which was at the Chicago Board of Trade back in May 2003 and then again in
December 2004. I had a huge response from folks who could not attend but were
impressed with my methods. I offer it on my web site, which is
www.nationalfutures.com. Both the book and the course are available on my site,
and I do get asked to autograph and add a personal message when these are pre-purchased
from my web site.
The Candlestick and Pivot Point Trading Triggers : Chapter 6. Pivot Point Moving Average System : Tag: Candlestick Pattern Trading, Forex, Pivot Point : day trading Strategy, day trade signals, pivot point, moving average trading, pivot point calculations - How do I start? Profitable Trading