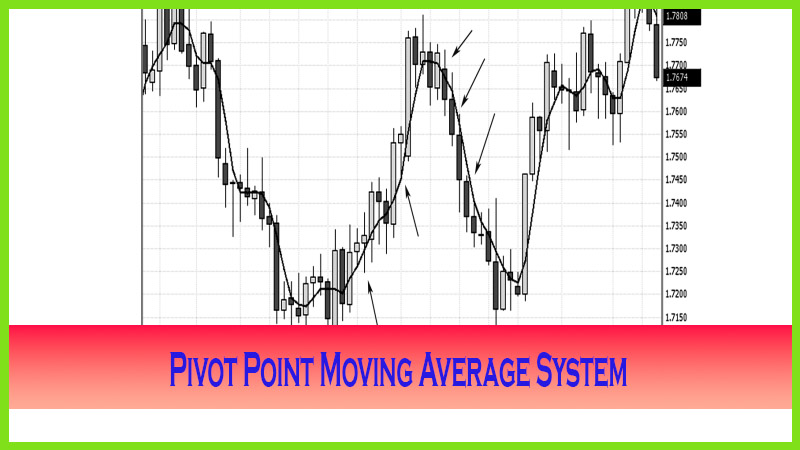
Trading Tips for Moving Average Using Pivot Points
pivot point moving average system, forex 3 moving average system, Moving average trading, ma trading strategy
Course: [ The Candlestick and Pivot Point Trading Triggers : Chapter 6. Pivot Point Moving Average System ]
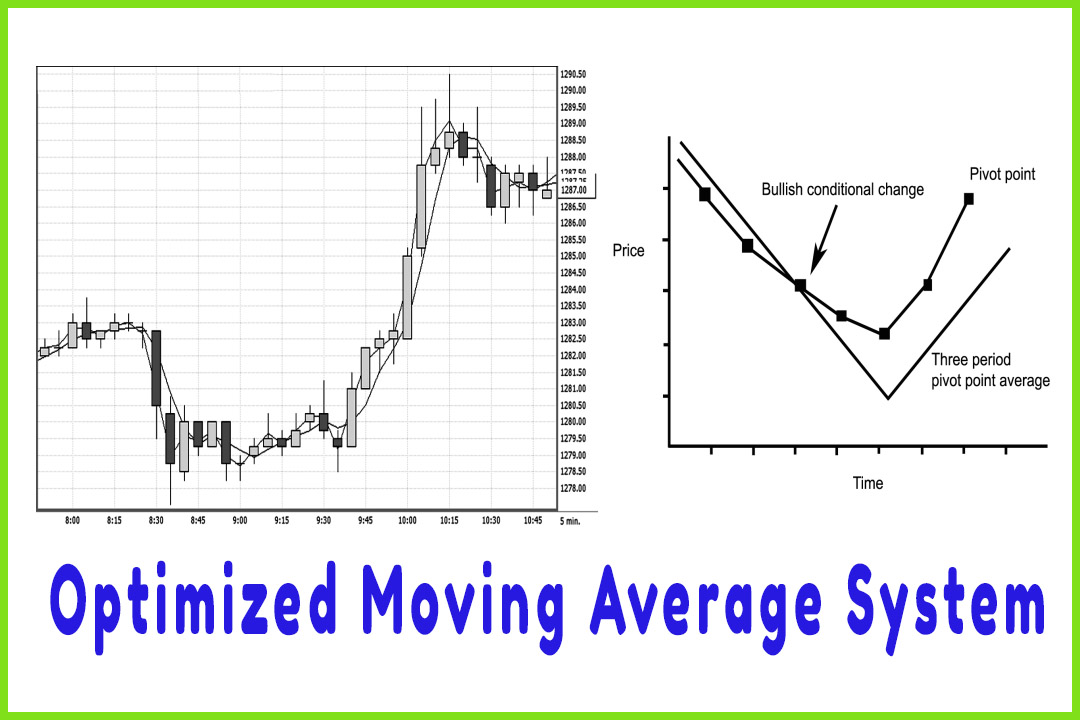
The moving averages have a good degree of separation or are equidistant from each other, which indicates a steady trending condition. The moving averages are trending in tangent or are parallel with each other, rather than one significantly outpacing the other.
TRADING TIPS
This is
an important point, so let me reiterate—What helps indicate the strength of a
trend when you use two or more sets of values for your moving averages are:
- The slopes of the moving averages are both pointing in the direction of the trend.
- The moving averages have a good degree of separation or are equidistant from each other, which indicates a steady trending condition.
- The moving averages are trending in tangent or are parallel with each other, rather than one significantly outpacing the other.
- If the shorter-term moving average separates or moves too far away from the longer-term moving average, then there is a potential for an overbought condition. Traders should start looking to liquidate half of their positions.
- When a crossover occurs, traders should liquidate the entire position
We have
not yet covered candle patterns, an integrating component of this trading
method. Most traders have a basic understanding of candle patterns, and I do go
over the more frequent and recurring ones. By now you may have seen dojis,
shooting stars at tops, and hammers at bottoms in this first section of the
book. There is a good reason for that, which we will cover. Right now, let’s
focus on the moving average components.
Figure
6.9 is a 5-minute chart on the CBOT mini-Dow looking at the same time period as
the e-mini-S&P in Figure 6.8. Notice the coincidence factor as both markets
form similar patterns at the same precise moment. I bring up this point because
it is important that as a day trader you follow like or similar markets to see
if there is confirmation throughout the sector. Besides, if one market rallies,
it is likely that the other market will rally as well. All 30 stocks in the Dow
are traded in the S&P 500. Therefore, they can be considered like, or
markets that will trade in tandem with each other.
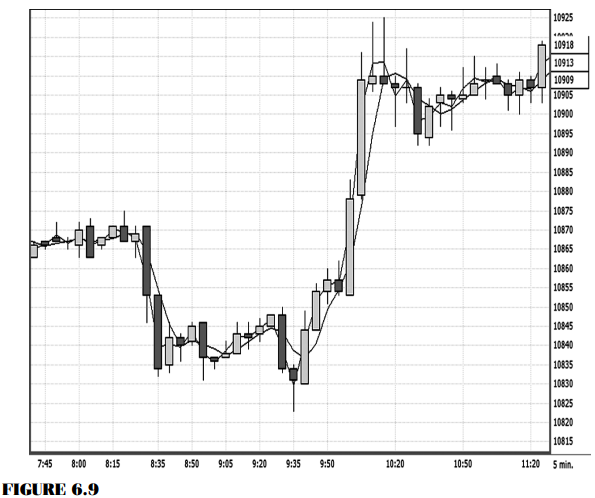
One market may develop a specific pattern that
is more pronounced than a pattern in the other market, and you can trade one
market based on a signal from the other. Notice in Figure 6.9 that the Dow made
a lower low on that day and was formed by what I call the jackhammer pattern,
which I will cover later.
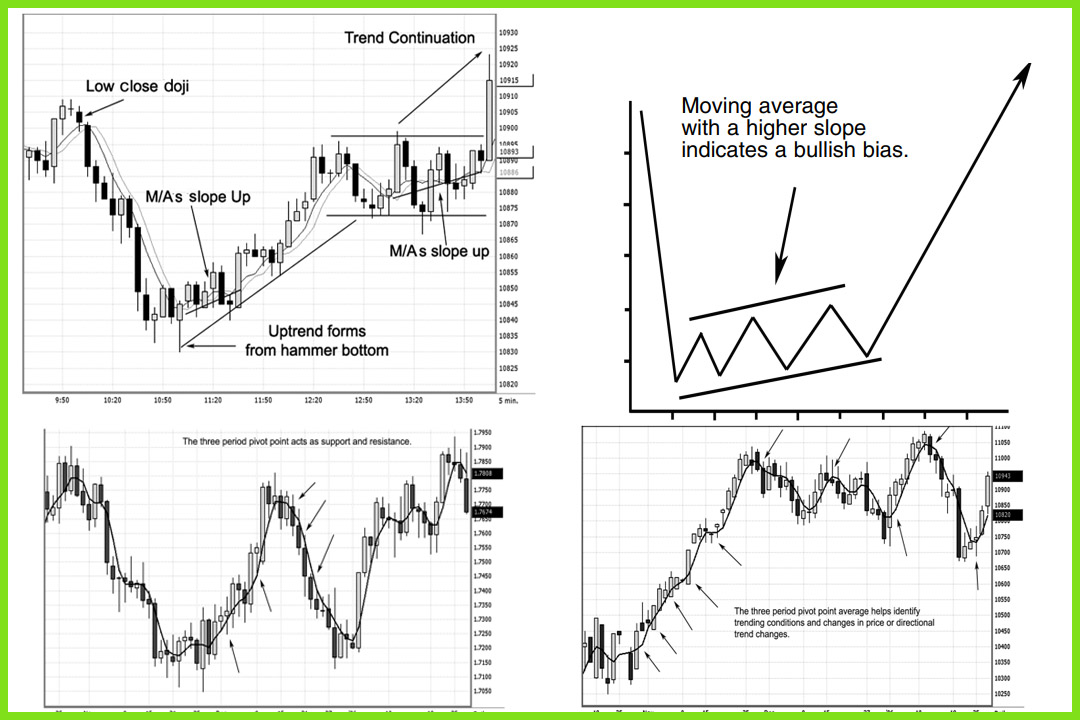
Watch the
relationship of the moving averages. Once the long white candle formed after
the hammer, which is the candle that made the lowest low point in the market,
the tall white candle closed above both moving average values and above the
hammer candle’s high. As prices started to move in a bullish trend, focus on
the action of the moving averages in relation to prices. The pivot point is
above the three-period moving average pivot point; prices form a sequence of
higher highs, higher lows, and higher closing values above both moving averages
and the prior time period’s highs. This series of conditions continued until
after the top was formed by a shooting star around 10:15 a.m. in conjunction
with the mini-S&P. The trigger to enter a long occurred at 10845 until the
first lower closing low, or conditional change, occurred when prices closed
below prior sessions’ lows and below the moving averages at 10895—a nice clean
50-point trade in the mini-Dow, or $250 per contract in less than 50 minutes.
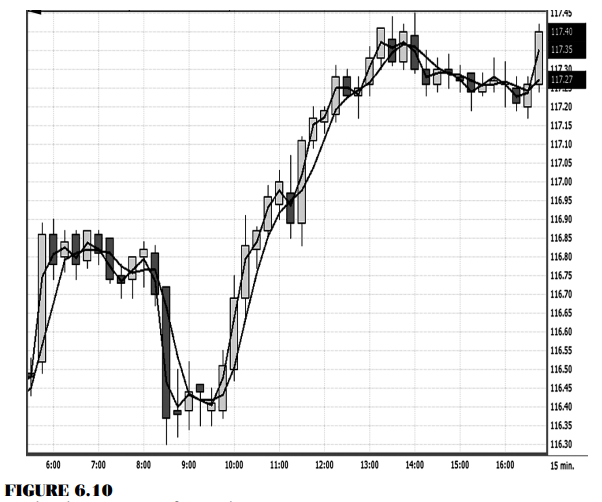
In Figure
6.10, let’s go over what the 15-minute chart on the spot forex yen looks like
with the COMAS method. If you look at the candle before 10 A.M., you will see
the moving average values actually crossed over first, before the long white
candle formed after 10 a.m. This gives an early warning and indicates that
there is a bullish bias. Keep in mind that it happened before the price action
confirmed a bullish trend with the sequence of higher highs, higher lows, and
higher closing highs. This feature allows you to have an early warning system
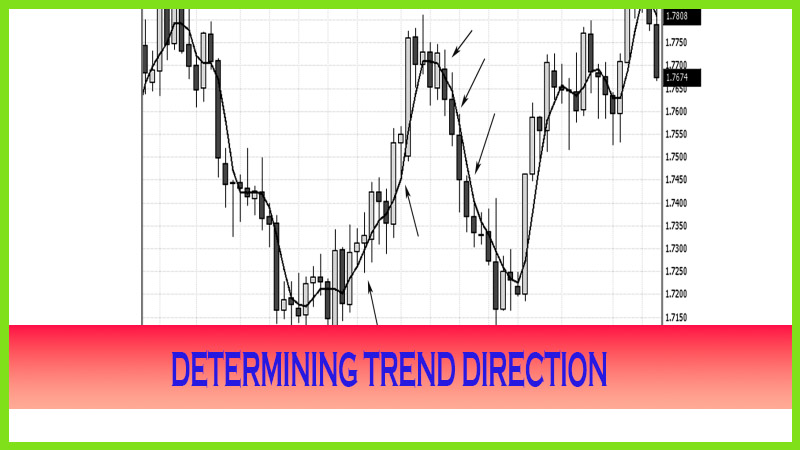
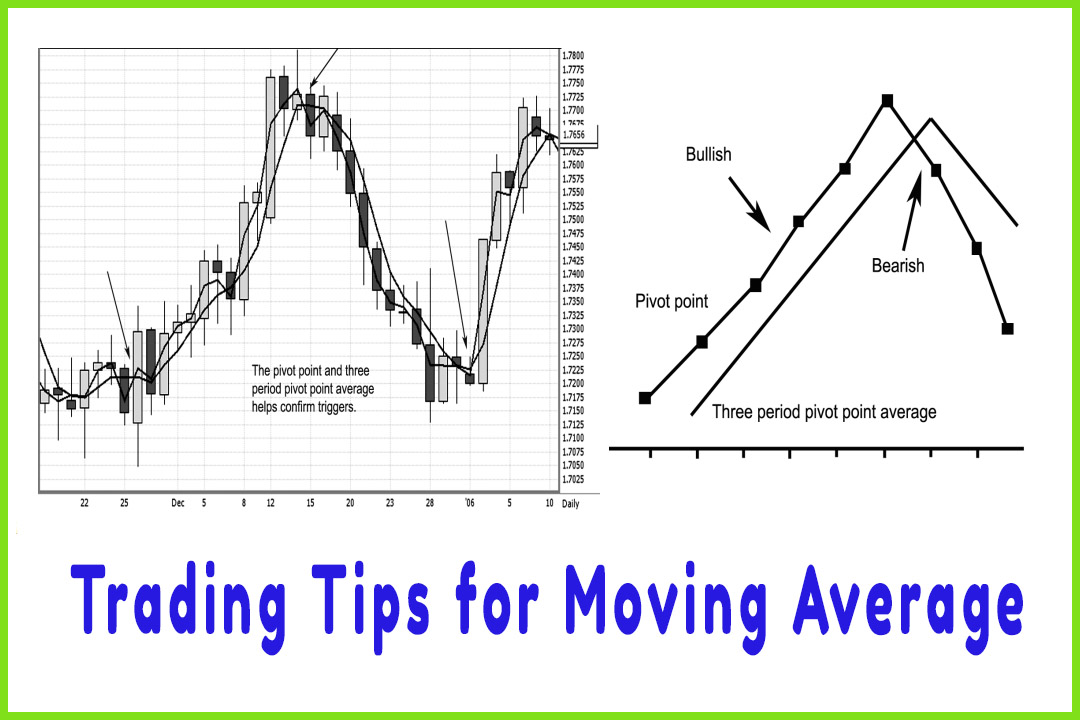
in place that helps spot directional trend changes. Look at Figure 6.11 with the
daily chart on the spot forex British pound. As you can see, the moving average
crossover that occurred on November 25 foretold of the bullish trend reversal
that carries the market from the 1.71 level all the way up to the 1.77 area. In
that trend run, you will see how the moving averages both lined up and acted as
support. By the time December 15 rolled around, see how the moving averages
cross back down, giving you an early warning that the trend was in jeopardy;
and sure enough, a bearish reversal occurred. From the peak made in December,
we see that the market declined, which triggered a sell signal when the pivot
point crossed beneath the three-period moving average.
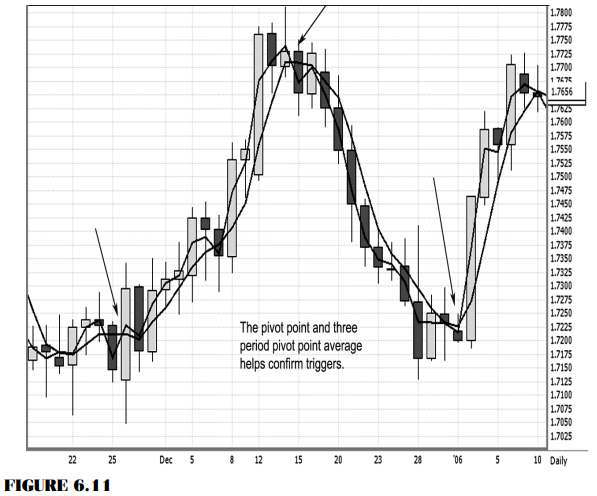
That not
only indicated a major bearish reversal but also showed that the three-period
pivot point acted as a resistance line all the way down as prices kept in the
bearish sequence of lower highs, lower lows, and lower closing lows. There is
one more element to that sequence, which is that a dark candle represents the
market closes below each time period’s open. Keep that in mind when we go over
candle patterns in Chapter 7.
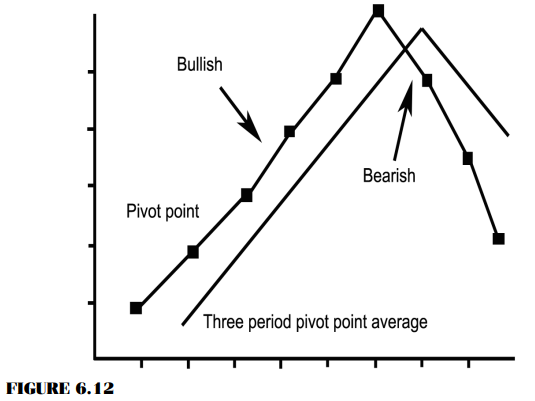
As
illustrated in Figure 6.12, the COMAS method can work in helping to determine
changes in market conditions from a consolidating phase to a bullish up-trending
phase and then back to a down-trending, or bearish, condition phase. This graph
illustrates a bearish conditional change in the market once the pivot point
crosses beneath the three-period moving average pivot point. Once you have
identified that a bearish condition exists, then you can trigger a short
position. As a general rule, a trader should look to sell from an area of
resistance in a market that is trending to the downside; that is, sell rallies.
A trader will see more profits in selling rallies than in buying breaks in
declining or bearish trending markets.
In
trading, as in life, timing is everything. There is nothing more frustrating to
a trader than to correctly analyze the market, correctly predict the direction
of the trend, get stopped out due to a premature entry, and then watch the
market move in the originally predicted direction.
As we all
determine early in our trading careers, being correct about the direction of
the trend is not enough. We must also be able to anticipate when the market is
setting up to trigger an appropriate entry into the market. The pivot point
combined with a moving average of the pivot point is one method that can help
you successfully identify when a conditional change may occur in the market.
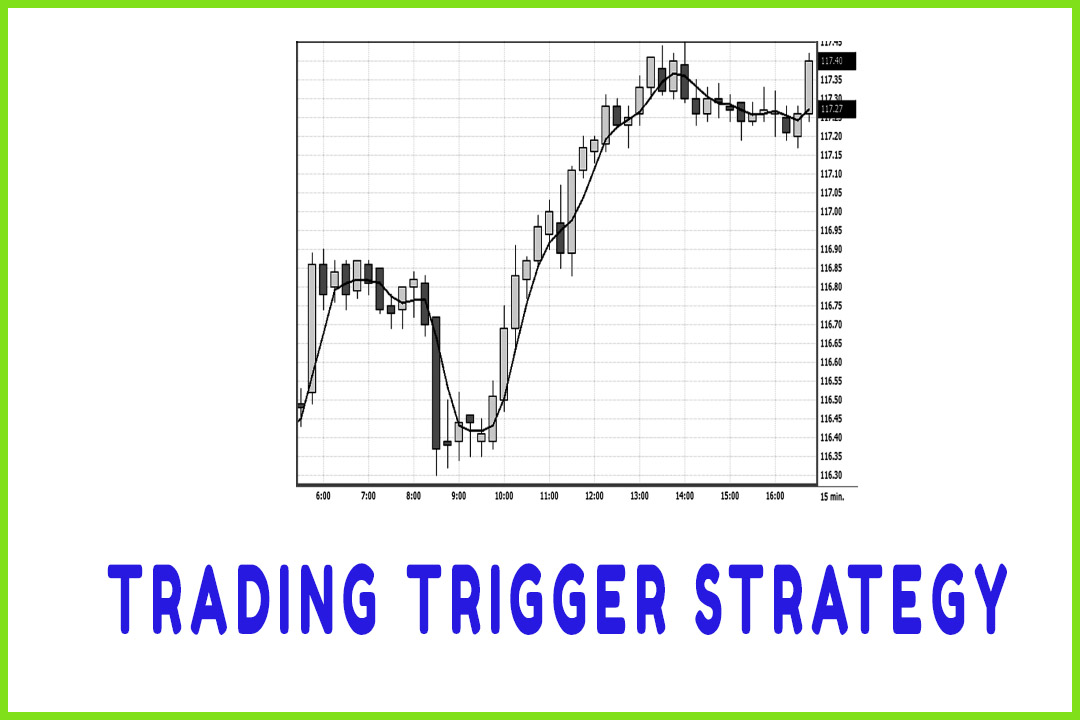
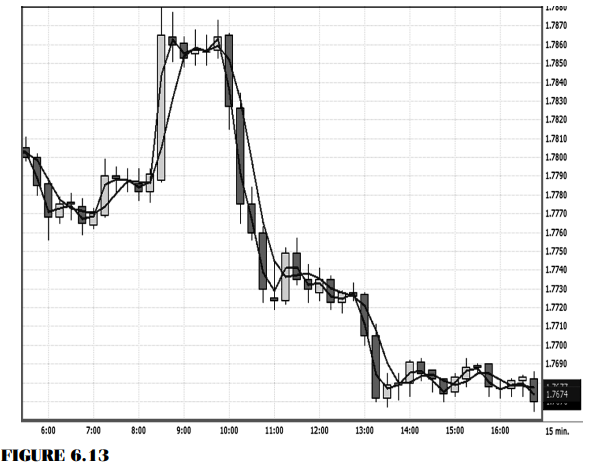
Let’s
look at Figure 6.13, which is a 15-minute chart on the spot forex British
pound. Notice the period after the long white candle at approximately 9:00
a.m.—prices go in a sideways mode or consolidation phase. The moving averages
also flat-line with a bias toward a downward slope. The crossover occurs,
followed by a lower closing low, a lower high, and a lower low; and the close
is below the open. In addition, the price is closing beneath both moving
averages; and, most important, the three-period pivot point moving average acts
as resistance, all the way down, until the market moves into a consolidating
phase.
The
concept of incorporating pivot point analysis with a moving average approach
will give you a testable, mechanical, systematic approach to trading. In order
to execute a trade, you need to have specific elements occur. Knowledge of
these elements will arm you with critical information that can help provide you
with protection from overtrading and from suffering from emotional pitfalls.
- In order to execute a trade, you need to see a change in market direction and commitment from the market to illustrate a change in market direction by closing above or below the moving averages.
- You need to follow some simple rules, such as take buy signals at support and take sell signals at resistance.
The
importance of this trading method is that you must be able to apply the
techniques on a consistent basis that allows you to make decisions in a
mechanical and non-emotional way. A common mistake that traders make is that
they do not test a strategy to make a logical determination about whether the
strategy is viable for their trading style. Many traders adopt a new strategy,
trade with it immediately, and start tweaking different components of the
strategy. Then they decide that there is no merit to the strategy, since it is
not profitable, and begin looking for a different strategy. A much better
approach is to establish a defined set of trading rules and test those rules
until an outcome is determined based on a reasonable number of trades. Patience
to wait for triggers and not act on the anticipation of an outcome and
discipline to follow through with that trigger are a must if you are to be
successful. These character traits can be learned and developed by implementing
this methodology. It is what I teach students and other highly successful
professional traders.
When the
price target has been met and the trigger has presented itself, enter the trade
without hesitation. Do not think about the entry; this is a mechanical process.
You have already done your homework, and you have satisfied your criteria. Your
system is in place, and this is part of the system. If you do not place the
trade when the trigger executes and confirms, you are not trading according to
your plan. Successful traders have the courage to act and act promptly. It is
important to recognize the immediate environment or market condition. Is it up,
down, or sideways? After a trend is established, let’s say a bullish trend, it
should consist of higher highs and higher lows; each period should close above
the open, and we should see higher closing highs. The pivot point moving
average should help verify this condition. In a bearish trend, we would want to
see lower highs and lower lows; each period should close below the open of each
period. Under these circumstances, the pivot point moving average should
confirm this market condition as well.
Traders
need to identify themselves, which will help them know the time frame to follow
in a trending market. Are you a day trader? Are you a swing trader who may be
in a position that lasts two to five days? Or are you a position trader? Once
you acknowledge what your time objective is, you can narrow down your goals and
your expectations for the trade. For example, when I am day trading, I will
generally be able to identify what the average range for a day is; I will
expect that if I miss 20 percent of the bottom and 20 percent of the top, while
waiting for a moving average crossover signal, then I can expect to only
capture 60 percent of the average daily range. Perhaps this can be achieved
only once or twice a day.
The Candlestick and Pivot Point Trading Triggers : Chapter 6. Pivot Point Moving Average System : Tag: Candlestick Pattern Trading, Forex, Pivot Point : pivot point moving average system, forex 3 moving average system, Moving average trading, ma trading strategy - Trading Tips for Moving Average Using Pivot Points