Simple Moving Average Trading Strategy - Pivot Method
technical analysis, moving average, Market Direction, Pivot Point Calculation, Support and resistance Level, reversal candle pattern
Course: [ The Candlestick and Pivot Point Trading Triggers : Chapter 6. Pivot Point Moving Average System ]
The simple moving average (the arithmetic mean) is the most popular moving average used in technical analysis. The simple moving average is the sum of the closing prices over a period of sessions divided by the number of sessions.
THE SIMPLE MOVING AVERAGE
The
simple moving average (the arithmetic mean) is the most popular moving average
used in technical analysis. The simple moving average is the sum of the closing
prices over a period of sessions divided by the number of sessions. For
example, a 10-day moving average would be the sum of the past 10 days’ closing
prices divided by 10. Each new day would drop the first day’s closing price and
add the new day’s closing price. As new data is added to the calculation, old
data is removed. By averaging the price data, a smoother line is produced, and
the trend is much easier to recognize. The disadvantage of the simple moving
average is that it only takes into account the time period of the sessions
covered in the calculation and that it gives equal weight to each day’s price.
In
Chapters 4 and 5, we covered the pivot point formulas and the significance of
pivot points as support and resistance. As you will recall, the pivot point
calculation provides the mean (average) for the session’s trading range, or
high, low, and close: (H + L + C)/3.
This
moving average section discusses how the moving average helps clarify the market’s
price flow by extending price analysis over a certain period of time. In this
manner, moving averages can accentuate when a market enters an extreme
condition by how far it departs from the mean. Price action either will move
toward the moving average or will return to the moving average to retest that
level.
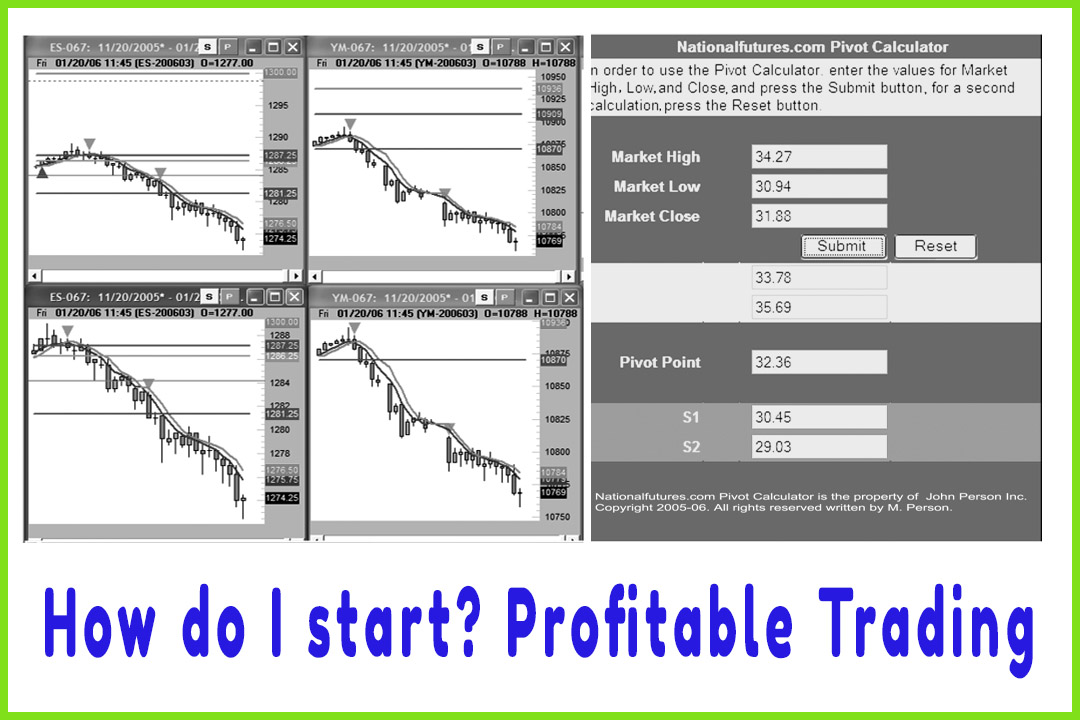
The “Market
Direction” number that was shown
in the Excel sheet in Figure 5.8 is a combination of the use of price session
information (pivot point number) over a period of time (moving average). The
market direction number utilizes cumulative data from the high, the low, and
the close for a session. This information provides a clear picture of the “average true
price” for that time period. The
market direction number is then calculated by taking the average pivot number
from the past three periods. Any time frame can be utilized to calculate the
number. However, the longer the time frame, the more significance the number
will hold. To calculate the market direction number, add three pivot points from
the same session, and divide the sum by three. The purpose of using the pivot
point in the moving average calculation is that the pivot point will show the
continuance of the trend.
Market Direction =Pivot + Pivot + Pivot/3
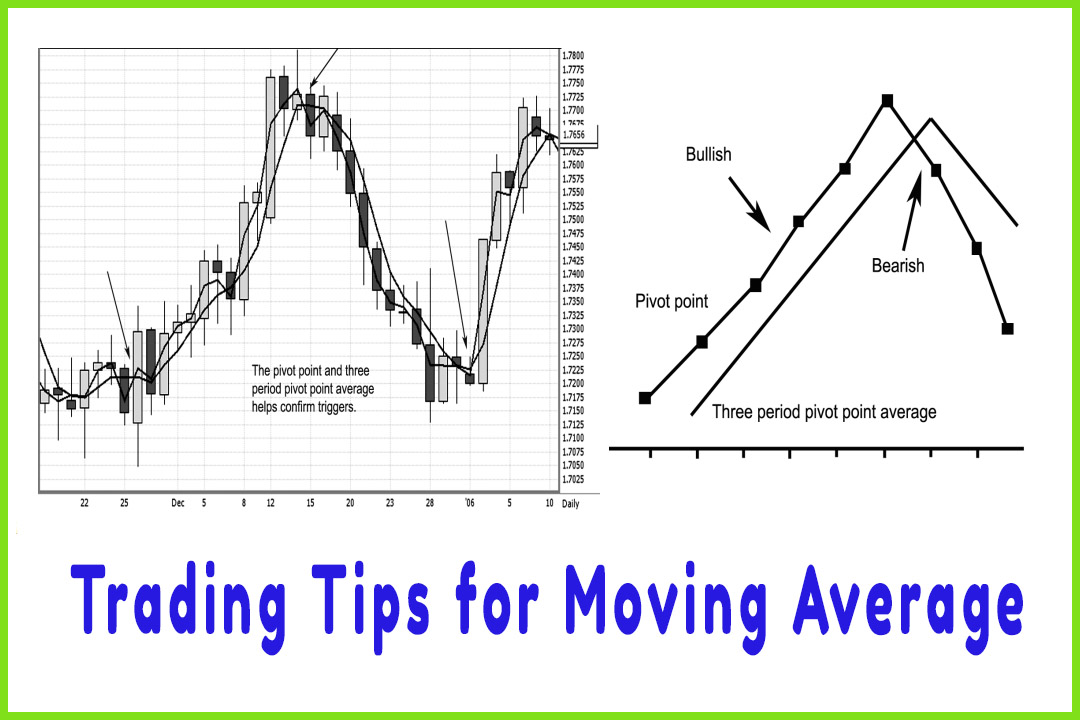
As stated
previously, the market direction number, which is a three period pivot point
moving average, can act as a support number in bullish conditions and has a
high degree of importance when one of the pivot point calculations for the
current session coincides with or is near that number. The market direction
number holds true as a resistance number in a bear market condition. If another
number coincides with the market direction number, such as the actual pivot
point or an R-1 (resistance level one) number, then it would serve as the
target high number for that specific time period. Another way of using the
three-period pivot point moving average is as a point of reference or fair
value. For example, when the market price departs, or deviates, too far from
the mean, then you can use the extreme resistance or support number, such as
R-2 or S-2 (support level two), or the farthest target number of that
direction, as a potential turning point. When various time frames are
incorporated into the analysis (daily, weekly, and monthly), there is more
certainty that the target price level can generate the anticipated reaction. If
the market gaps too far from the daily pivot point moving average, use the
monthly and/or weekly target support and resistance numbers to help identify a
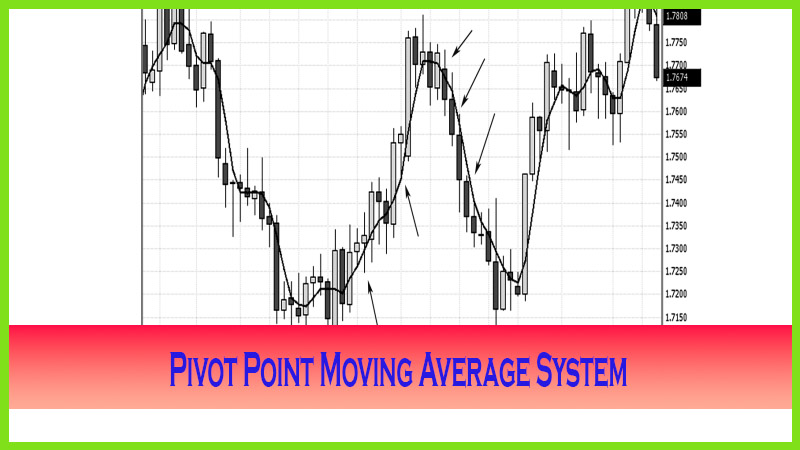
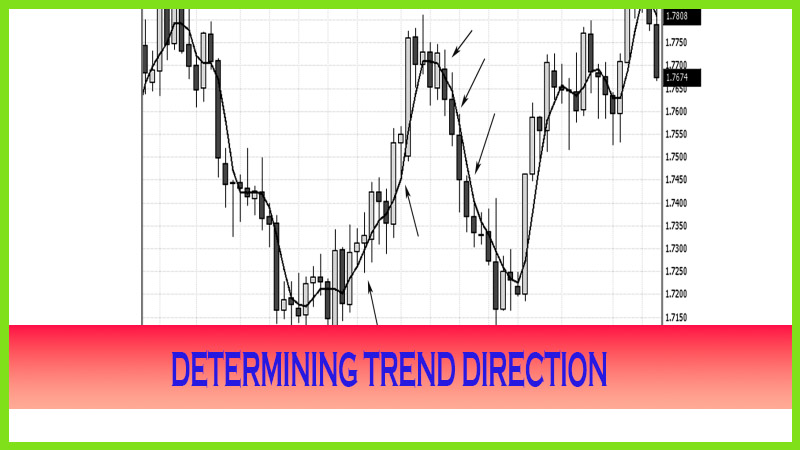
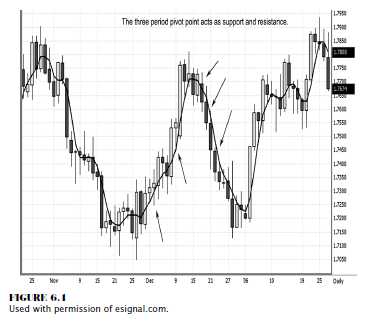
targeted reversal support or resistance point. Figure 6.1 shows a spot foreign
exchange (forex) British pound daily chart with the three-period pivot point
moving average overlaid on top of prices. Notice that as the market changes
conditions from bearish (downtrend) to bullish (uptrend), prices bounce off the
moving average as a support line and then trade off the moving average as it
acts as a ceiling of resistance. If you notice the price action from November
15 to November 25, you will see that the market entered a consolidating phase
as prices moved above and below the moving average. The moving average went
virtually in a flat line with a bias to an upside slope. This was hinting that
prices were getting ready to change direction. When you watch the moving average
in relation to the underlying price action, sometimes you can get clues as to
the true market price direction using the pivot point moving average. Due to
the weighting of the high, low, and close combined, the moving average factors
in the typical price of that time period, thus giving a better gauge of market
value. If the close is closer to the high, the average will be at a higher
assigned value. Using the three-period pivot point will help you filter out
much of the market noise and will give you a truer sense of the market’s fair
value within the price range of the past three trading periods.
At times,
the slope, or angle, of the moving average can give you a clue as to the
market’s true strength or weakness, especially when combined with candlestick
charting.
The slope helps filter out the noise, and you
can see if the market’s value is progressively appreciating or depreciating.
When a market goes from the trending phase into the consolidation phase, it is
the slope of the pivot point moving average that can help you identify the
potential price direction the market makes next from the consolidating phase,
such as if the market will make a continuation or a trend reversal move. For
added clarity, when combined with identifying a high probability bottom or
top-forming candle, you have added confirmation of a potential move.
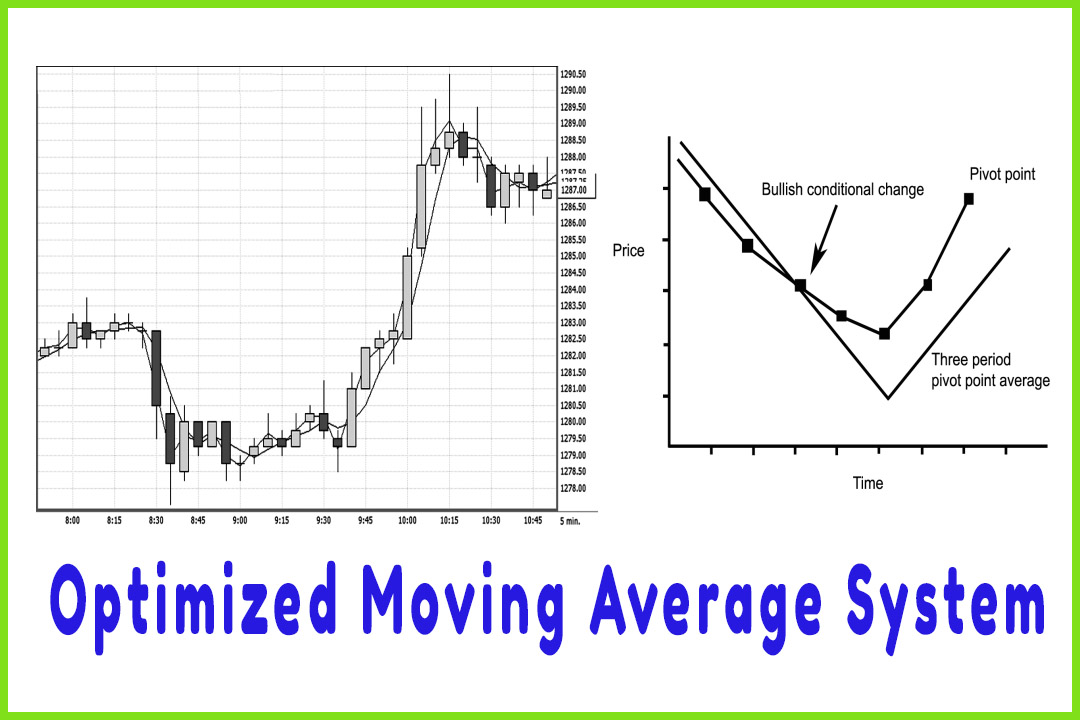
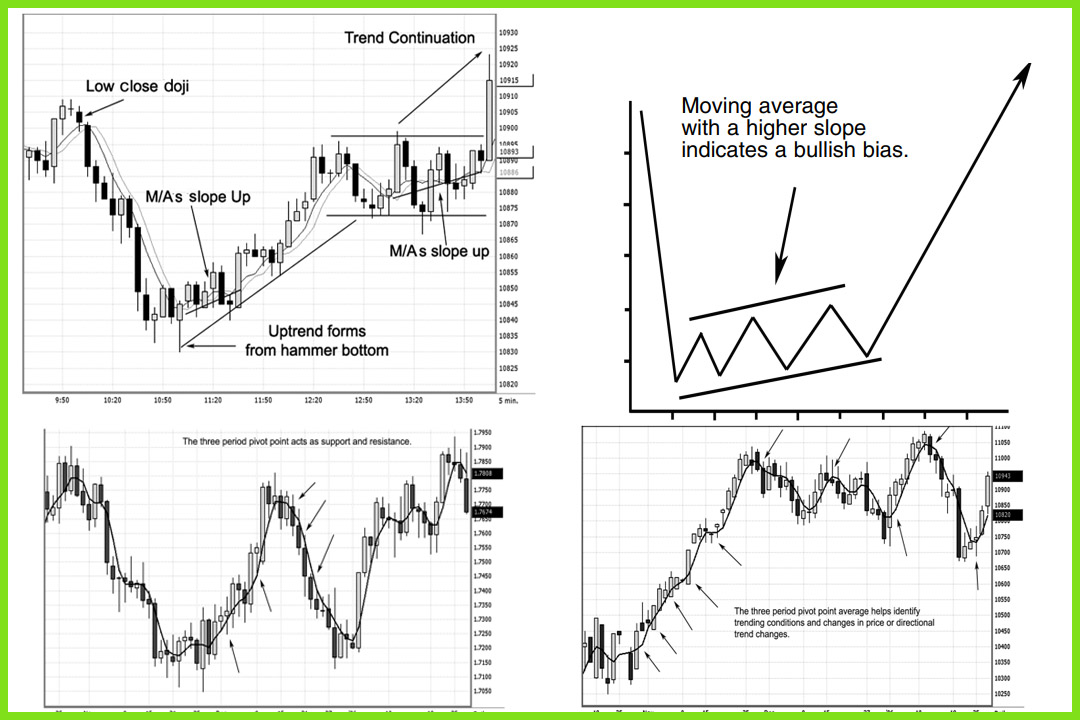
In Figure
6.2, the graph shows a representation of a pivot point moving average in a
declining trend phase. Then as prices consolidate as the pivot point average
measures the typical price rather than the close, we can determine what the
true market value is and which way prices tend to be moving. Markets sometimes
demonstrate extreme volatility at turning points, and the moving average
approach can help filter out the noise inflicted by wide price swings. These
swings often lead to confusion or worse—traders getting whipsawed, causing loss
in trading equity.
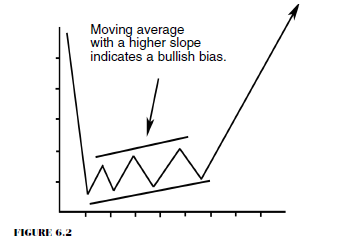
As the
moving average slopes up, it indicates that the market values are also tending
to trade higher. Eventually, we see a trend reversal, which is what the
direction of the moving average indicated.
In Figure
6.3, let’s look at a five-minute chart on the Chicago Board of Trade (CBOT)
mini-Dow contract. Just to clarify, the minimum tick fluctuation is a one-point
move, and every point is worth $5. So the overall contract value is $5 times
the index. If the Dow is at 10500, the contract value is $52,500. This may not
make sense now, but as you read the book further, you will understand what the low
close doji sell signal is about and what the specific rules are for entering on
this pattern. For purposes of illustrating what phase a market goes in and how
the pivot point moving average can help you follow a market, let’s look at the
sequence of events:
- The market develops into a downtrend.
- At the bottom, a bullish reversal candle pattern forms.
- Prices start trading wildly, but the moving averages (M/As) are sloping higher.
- The market reverses and then goes into a sideways channel or consolidating phase. (If you examine the pivot point moving averages, you will see they were pointing higher while prices were in the congestion phase.)
- Prices finally break out and continue the uptrend.
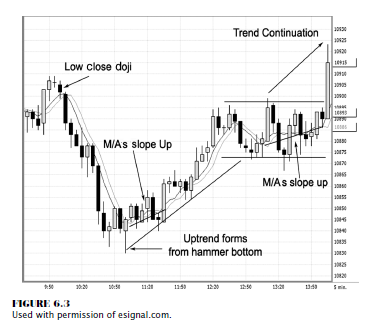
This
chart was from 2/10/2006; prices went on to trade that day as high as 10963.
The moving averages did alert you to the internal strength, and the price
direction did continue higher—a pretty good method for getting a clue to the
market’s next move.
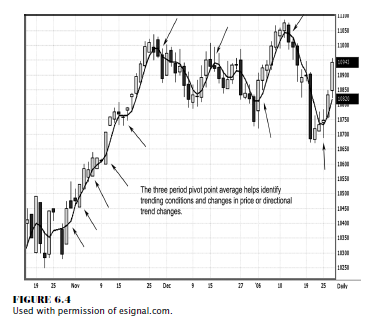
In Figure
6.4, we have the CBOT mini-Dow contract, which shows that the market was coming
out of the congestion, or consolidation, period in late October. The
three-period pivot point moving average was also flat-lining with an upward
slope in the direction of the moving average. Once the market made a break for
it by establishing the uptrend, the average helped identify the trending
condition. As the chart illustrates, the pivot point moving average actually
hugs the market’s lows when in an uptrend and the highs in a downtrend. It also
helps to identify the conditional changes when the market makes reversals.
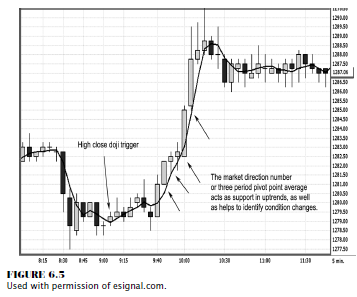
This
moving average approach works just as well for active day trading markets, such
as the e-mini-Standard & Poor’s (S&P) shown in the 5- minute chart in
Figure 6.5, as it does for swing or position traders.
This
method can help active day traders to see and to confirm changes in price
conditions, such as when the market is in a consolidating period to trending
mode. Notice how the moving average acts as a support once the market starts
the breakout in the uptrend.
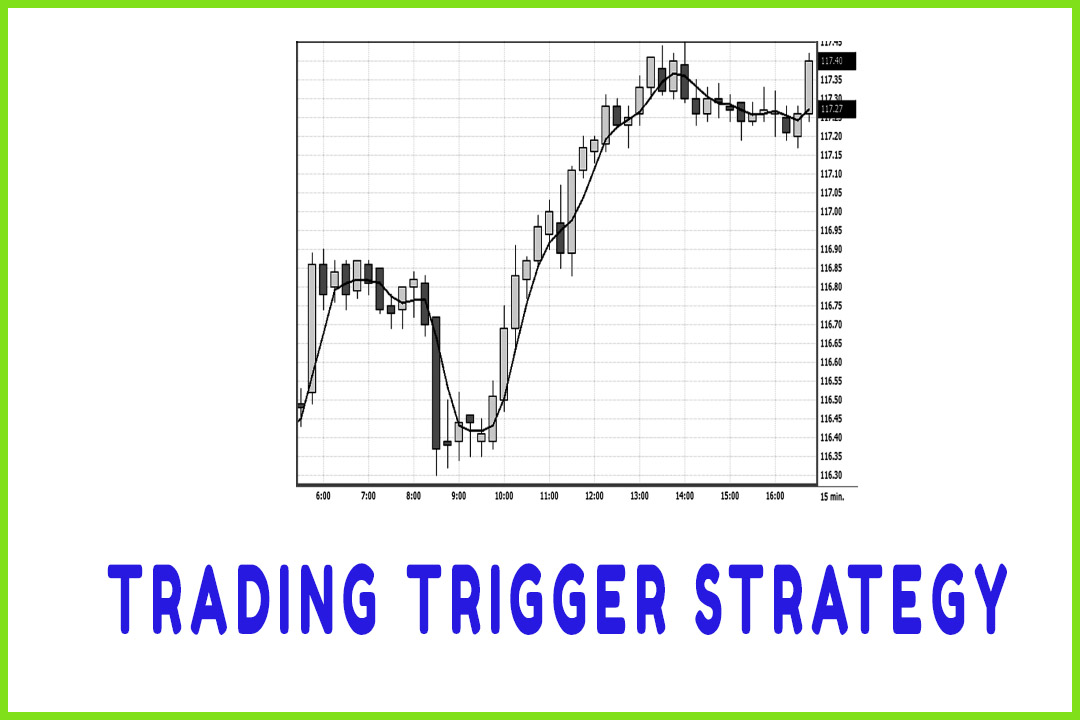
The
three-period pivot point moving average works as a tool to confirm triggers and
exits by price action closing above or below the moving average pivot line. In
Figure 6.6, we have a 15-minute chart on the spot forex Japanese yen currency.
As the market forms a bottom at 9:00 A.M., notice how the moving average shows
a cup formation and that the price of the market closes above the moving
average. This gives us a clue that the market is starting to change from a
bearish trend condition to a consolidating phase and that the market is
starting to move into a reversal of the current trending condition. As the
market starts to establish higher highs and higher lows, it also is closing
above prior highs and, most important, closing above the three-period pivot
point moving average. Now the average starts to act as a support target until
prices reach the top, and the moving average starts to flat-line again as
prices go into another consolidating phase. The Japanese yen chart provides a
good example of a high close hammer trigger, confirmed by the price closing
above the moving average pivot line.
The Candlestick and Pivot Point Trading Triggers : Chapter 6. Pivot Point Moving Average System : Tag: Candlestick Pattern Trading, Forex, Pivot Point : technical analysis, moving average, Market Direction, Pivot Point Calculation, Support and resistance Level, reversal candle pattern - Simple Moving Average Trading Strategy - Pivot Method