Deep Wave (b) in Wave (iii) in EURUSD Daily Chart
Trade retracement, Strength Harmonic Structure, Accuracy Harmonic Structure, Five wave pattern
Course: [ Harmonic Elliott Wave : Chapter 4: Projection and Retracement Ratios ]
Elliott Wave | Forex | Fibonacci |
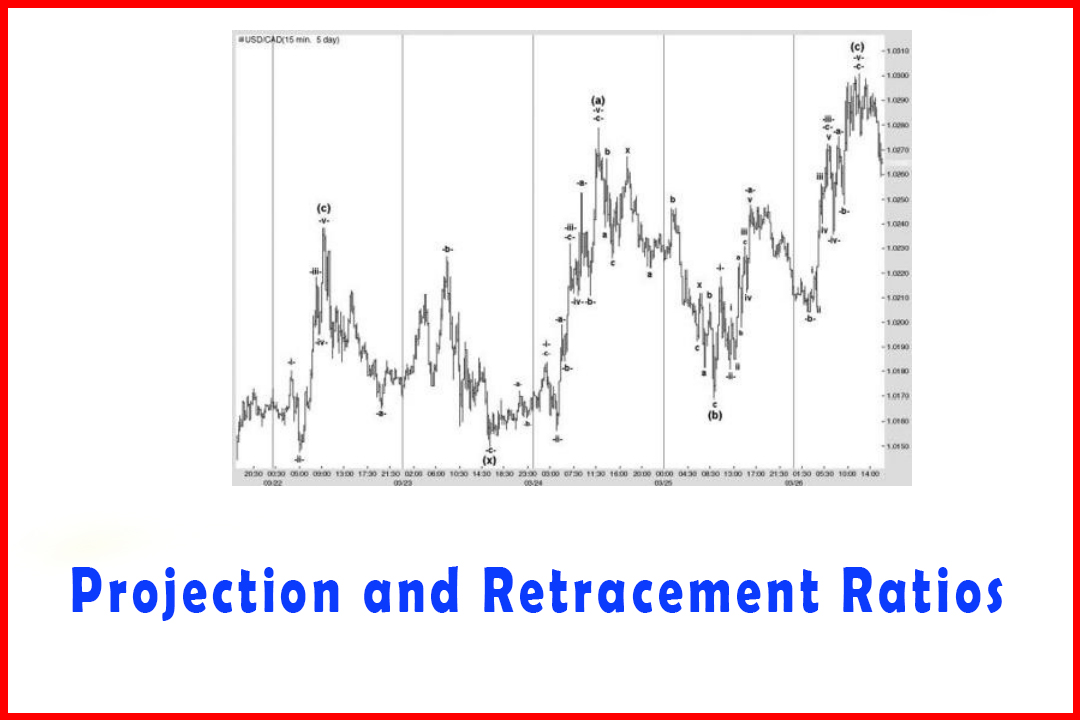
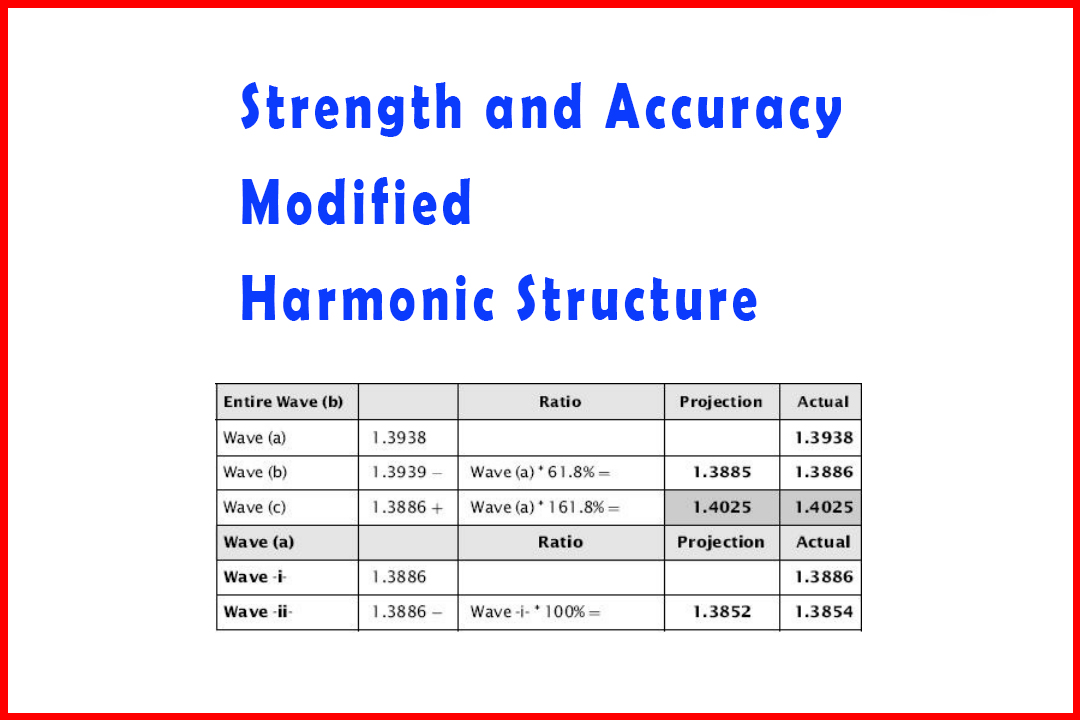
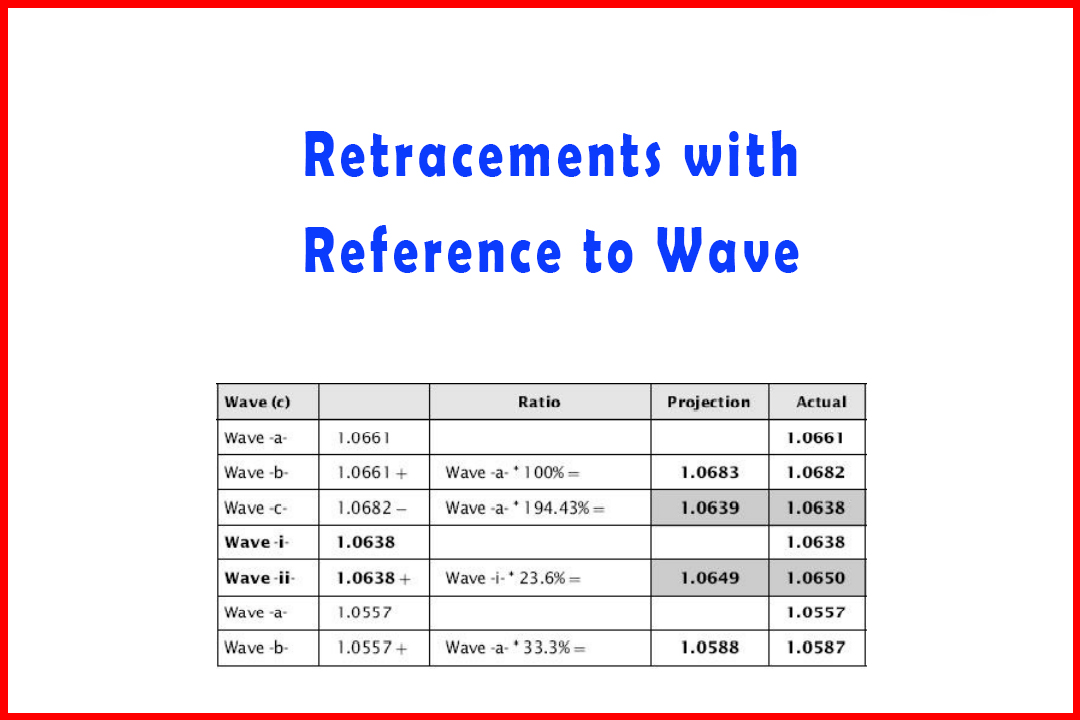
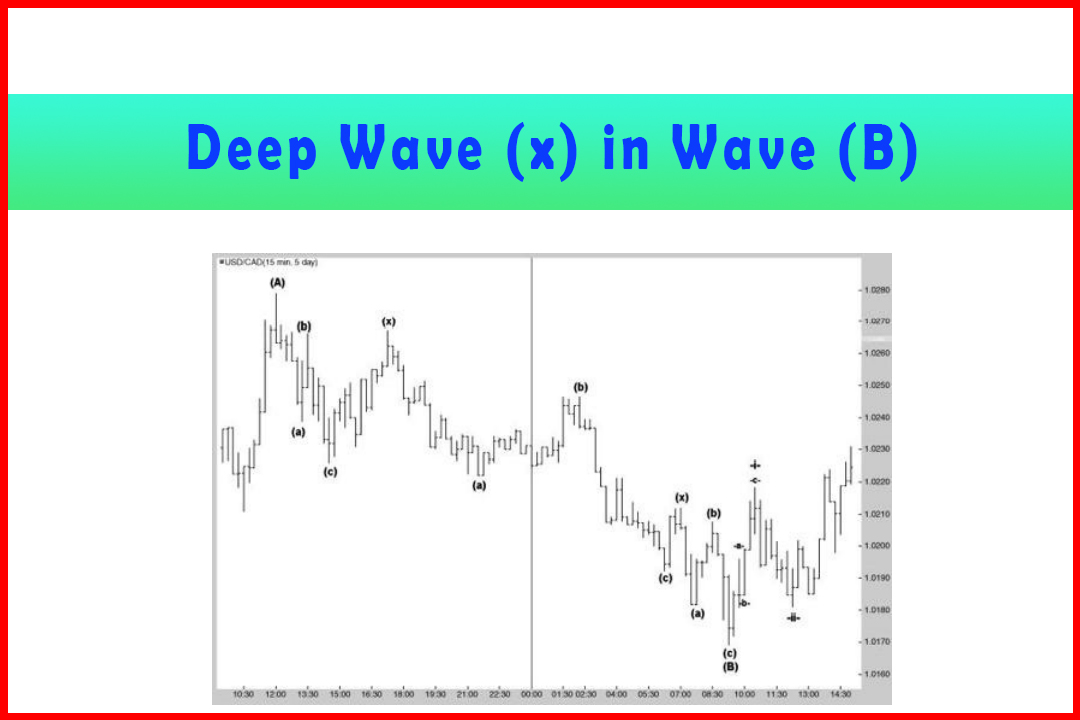
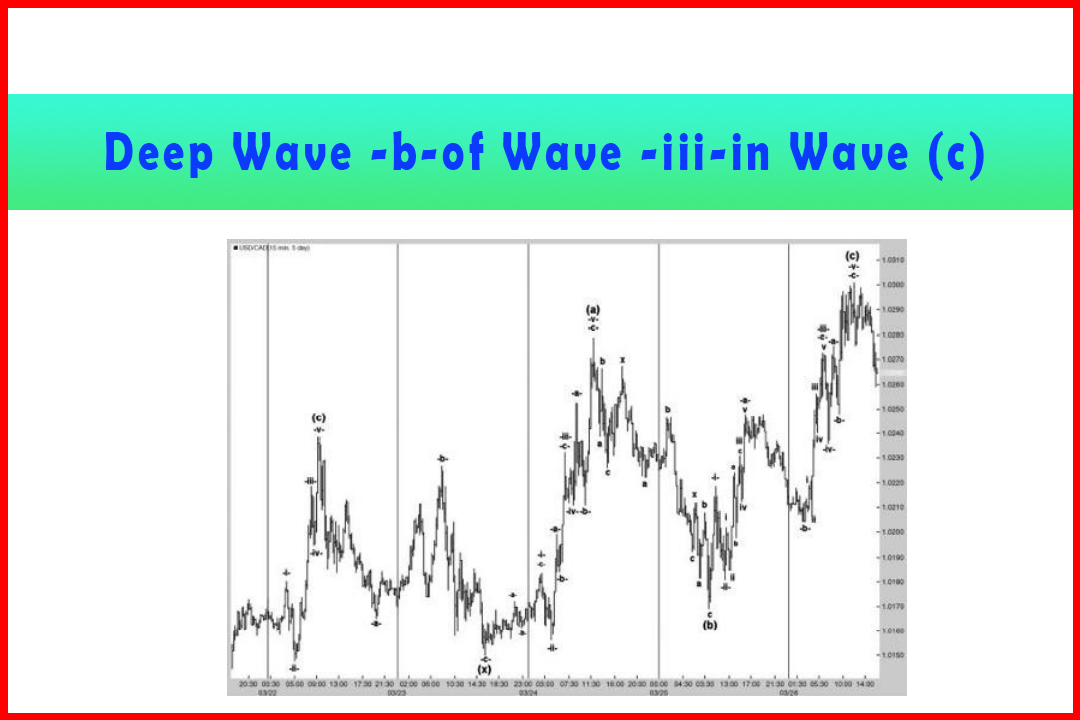
I have provided several examples of how accurate the modified structure can be within the short time frames.
Deep Wave (b) in Wave (iii) in EURUSD Daily Chart
I
have provided several examples of how accurate the modified structure can be within
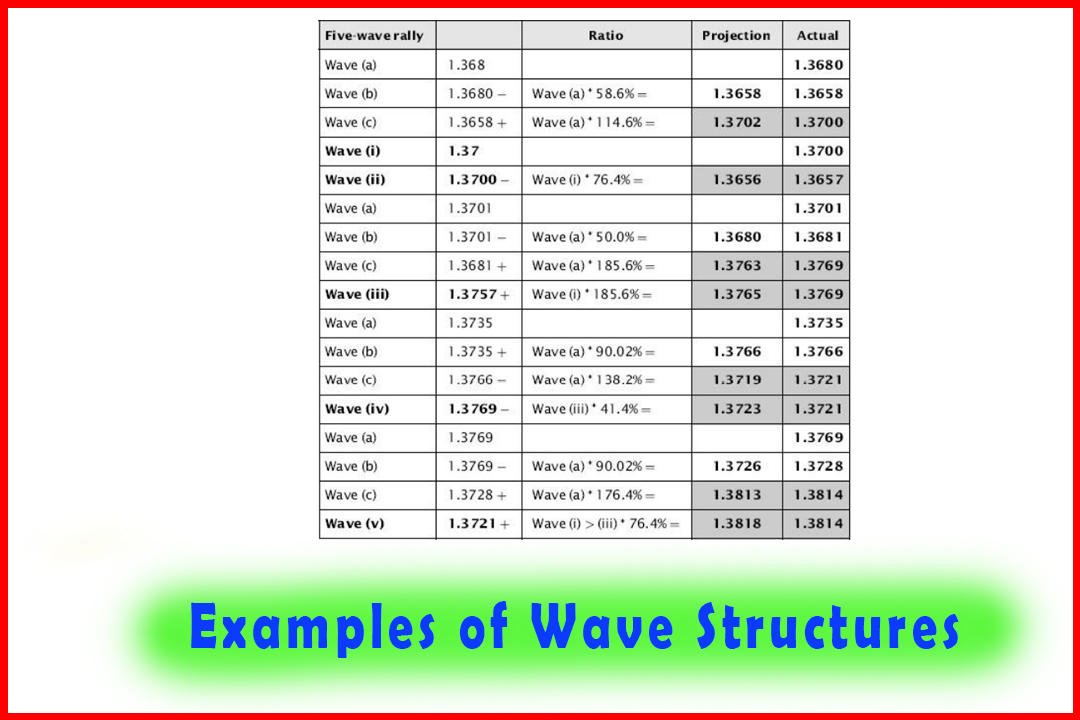
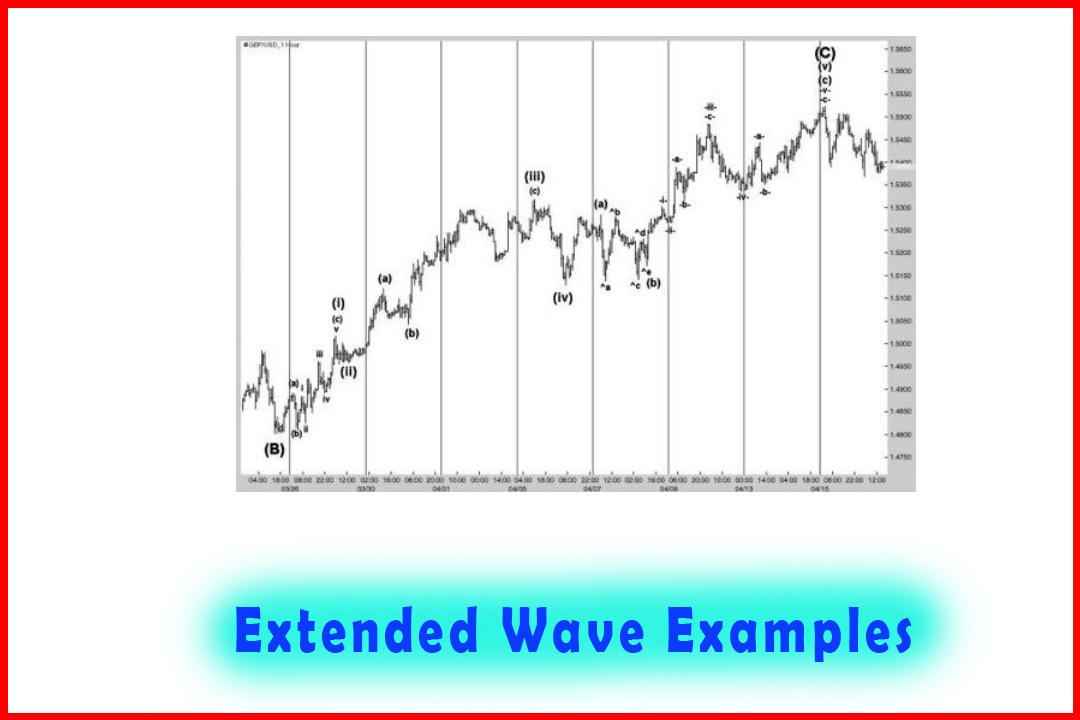
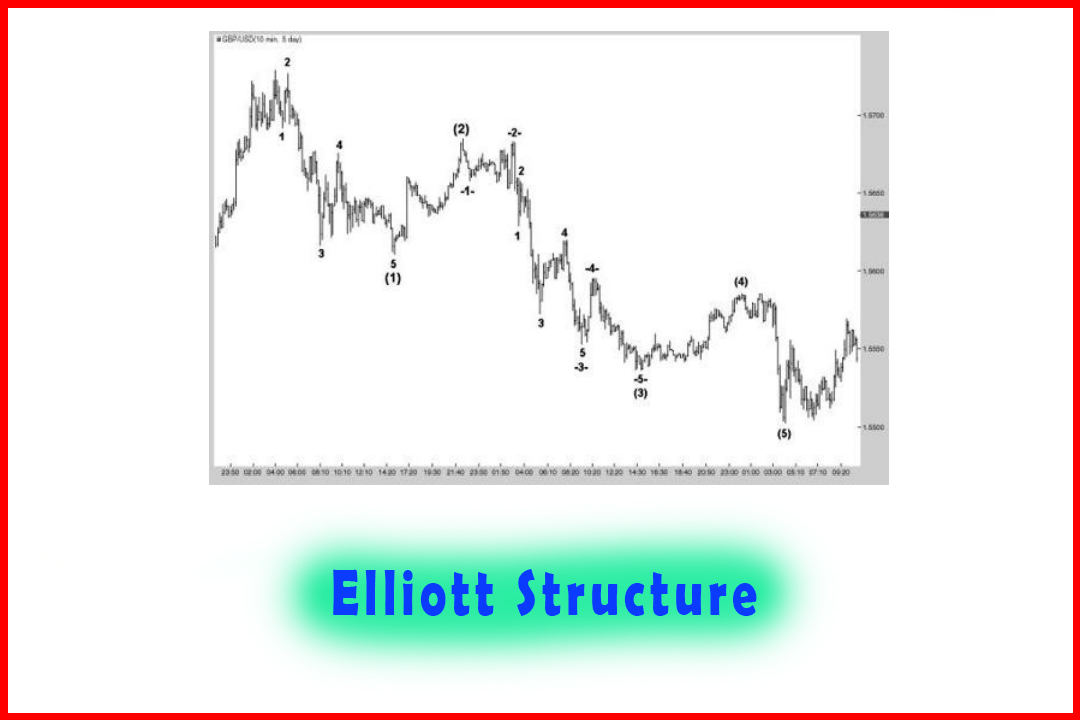
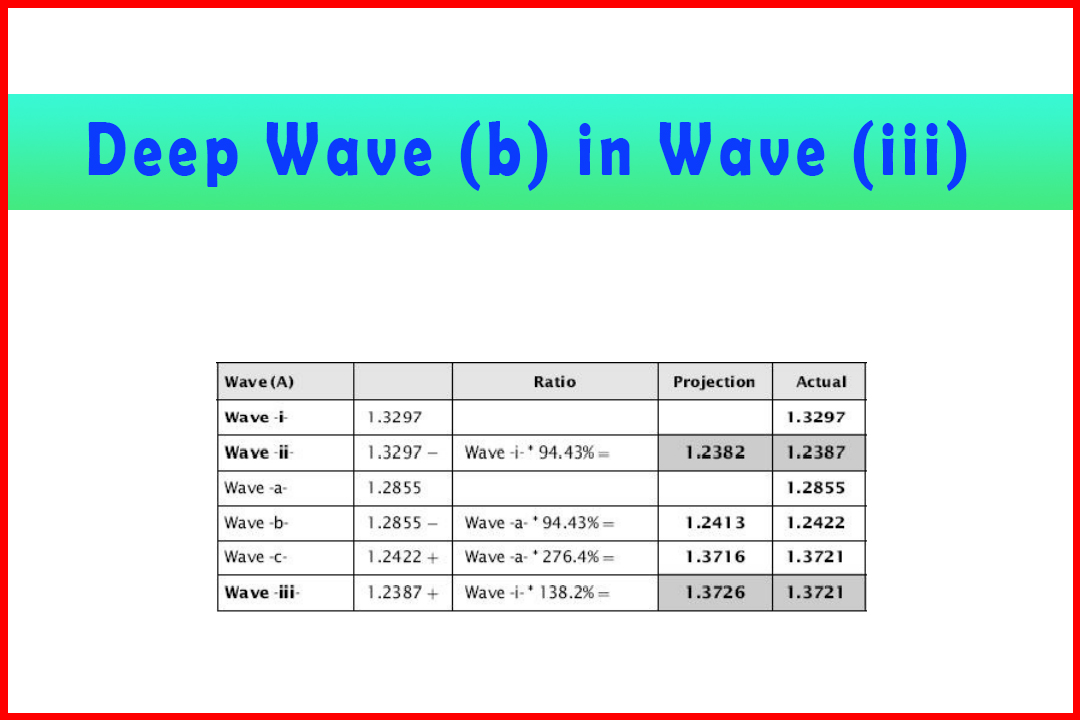
the short time frames. Moving up the scale to daily charts (Figure 4.22), the
degree of variance in projections certainly becomes larger in point terms
(Table 4.18).
Figure 4.22
Potential Development of a Daily Triangle in EURUSD Including a Deep Wave (b)
of Wave (iii)
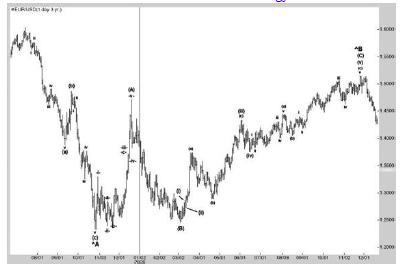
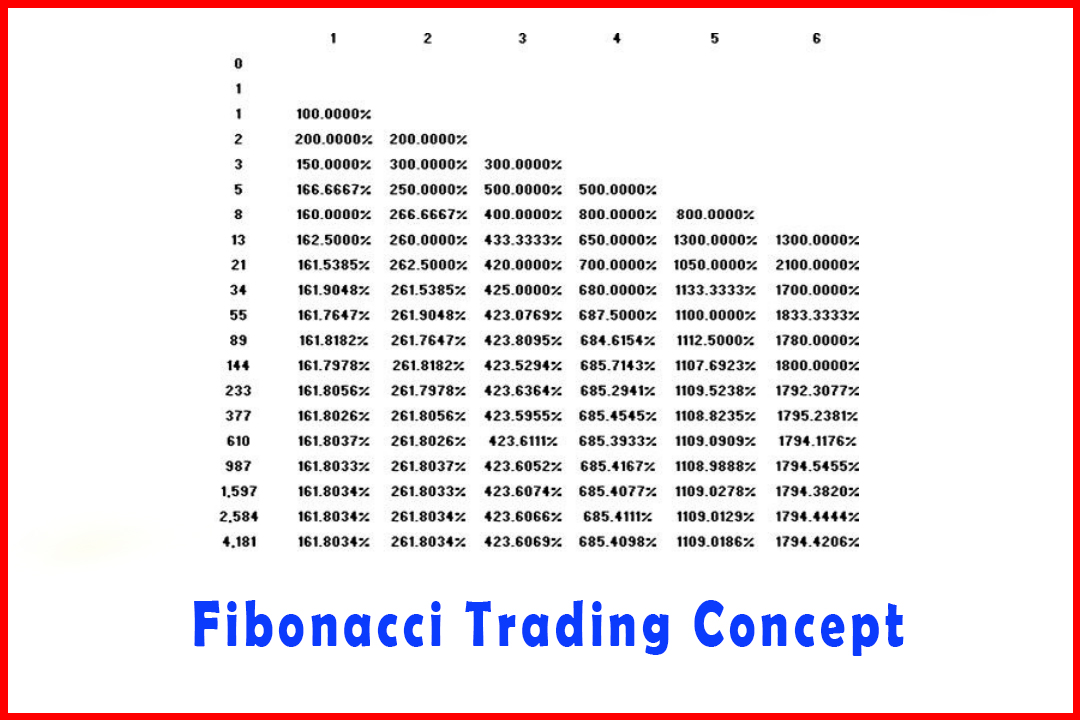
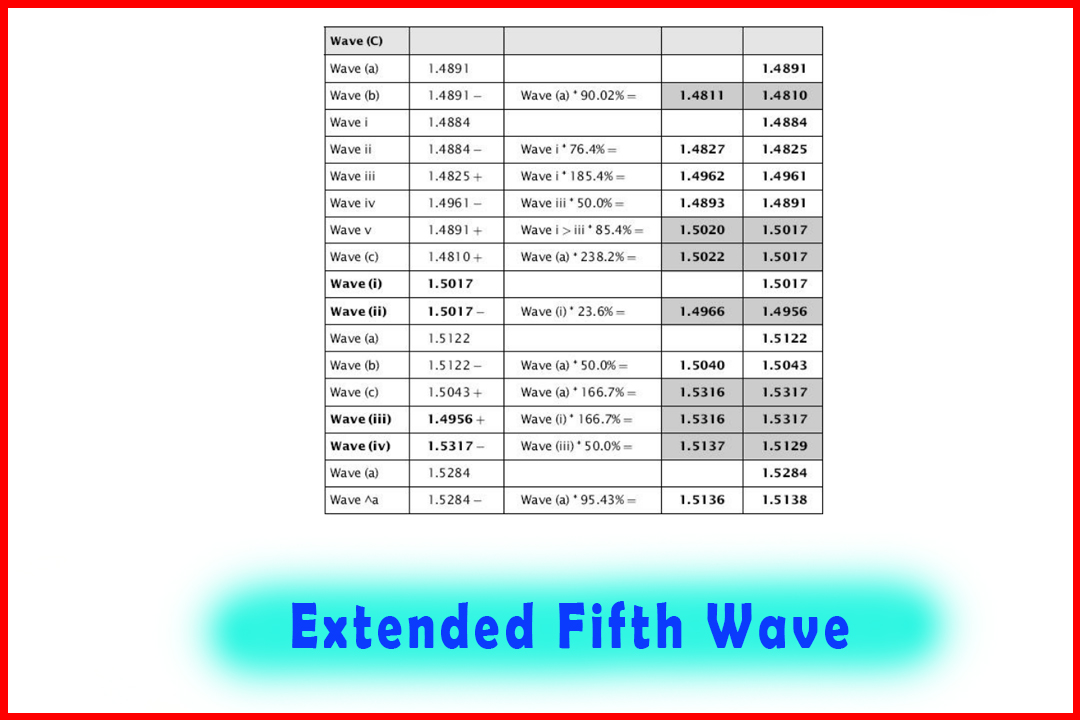
Table 4.18 Wave
Relationships for the Potential Development of a Daily Triangle Shown in Figure
4.22
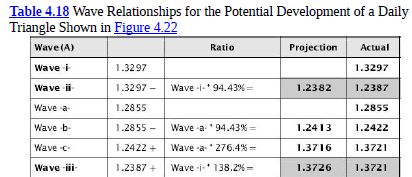

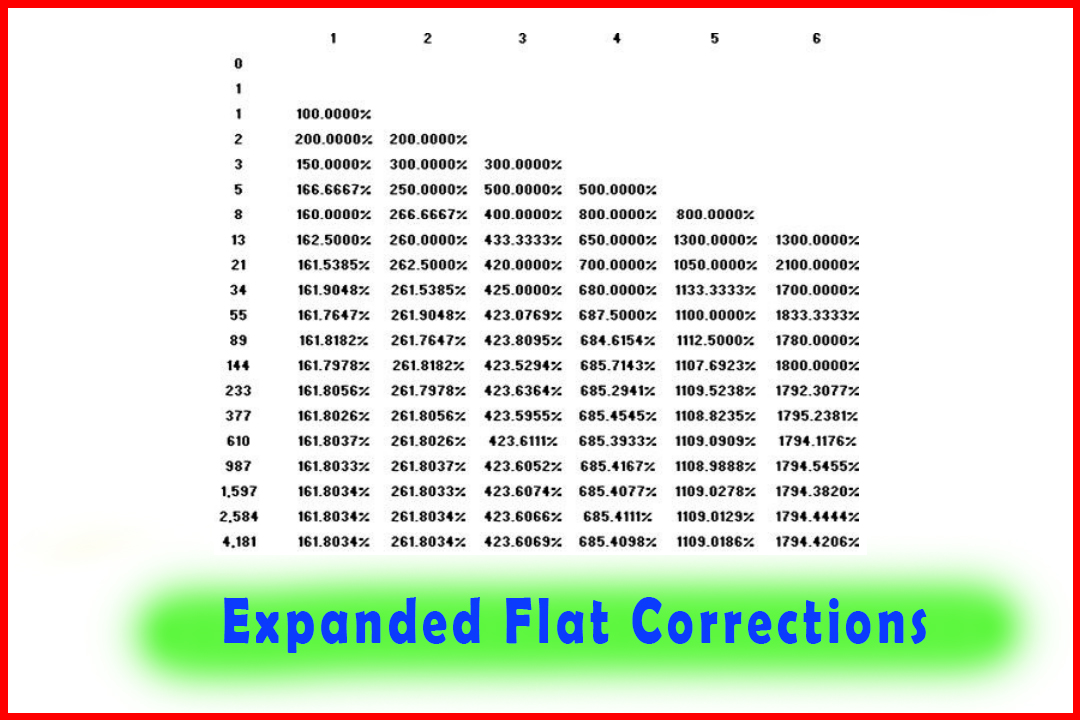
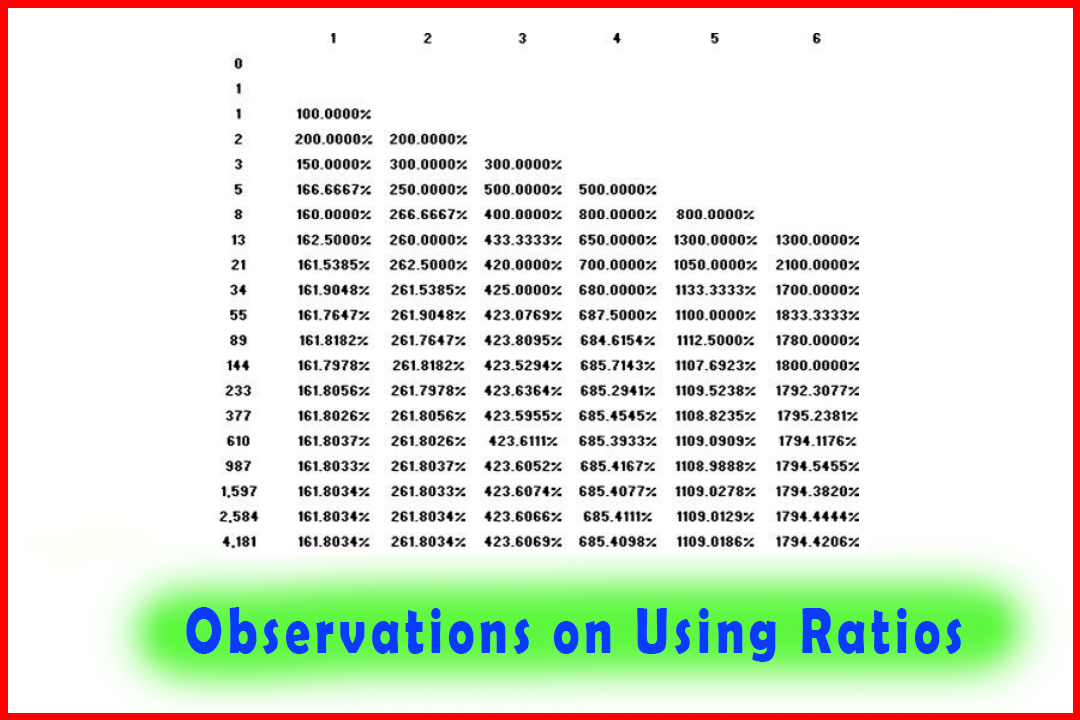
Very
clearly some of the ratios implied are rather unusual but closely related to
Fibonacci or harmonic ratios as an extension to prior waves. What it does
highlight is that while the ratios are all valid, forecasting can end up being
very trying.
Such
events can end up being a 20/20 hindsight forecast, and certainly I found the
sequence in Wave (C) one of the most difficult. Strangely enough, I did
forecast the 1.5143 high, my target being 1.5146, but by using a different
structure in the move higher. Thus, once the decline developed I had been
looking for a much shallower correction, specifically at 1.4207 and 1.4048.
Indeed, there were reactions from 1.4217 and 1.4028 respectively, but by this time
the momentum conditions were still quite bearish and did not indicate any
potential for a reversal, and price actually penetrated the anticipated support
levels forcing a change in outlook.
There
are always multiple potential projections in most areas of the wave structure,
and while tying together projections from different wave degrees, both higher
and lower, can generate high confidence areas of wave terminations, use of
other complementary techniques can help to fine-tune or even identify when a target
is not going to hold.
I
should stress that even if there are times when price conditions are clouded
and uncertain, the eventual end of a move that is finally realized after the
event does constitute valuable information since it actually provides clarification
of the wave structure of one higher degree. From that point it provides
guidance for the expectations of the subsequent wave development.
In
Chapter 5, I will cover this subject and provide some tips on how to approach
forecasting and recognizing when anticipated structures begin to break down,
and general signals that can forewarn you of confirmation or denial of
structures.
Harmonic Elliott Wave : Chapter 4: Projection and Retracement Ratios : Tag: Elliott Wave, Forex, Fibonacci : Trade retracement, Strength Harmonic Structure, Accuracy Harmonic Structure, Five wave pattern - Deep Wave (b) in Wave (iii) in EURUSD Daily Chart
Elliott Wave | Forex | Fibonacci |