Deep Wave -b-of Wave -iii-in Wave (c) Higher in USDCAD
Trade retracement, Strength Harmonic Structure, Accuracy Harmonic Structure, Five wave pattern
Course: [ Harmonic Elliott Wave : Chapter 4: Projection and Retracement Ratios ]
Elliott Wave | Forex | Fibonacci |
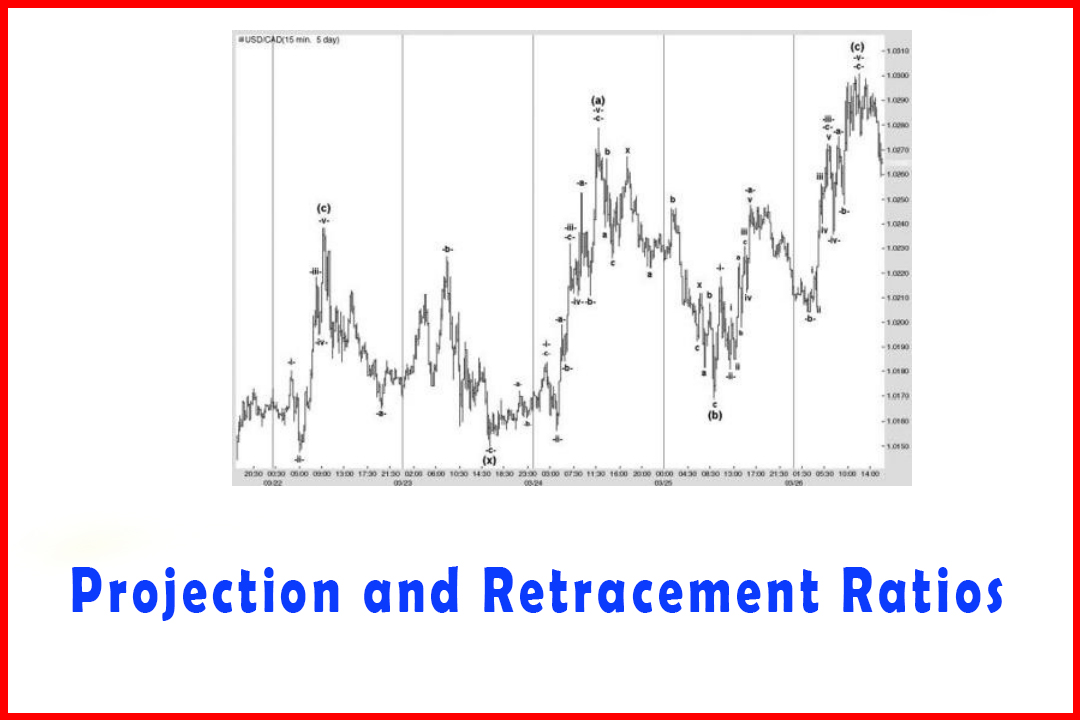
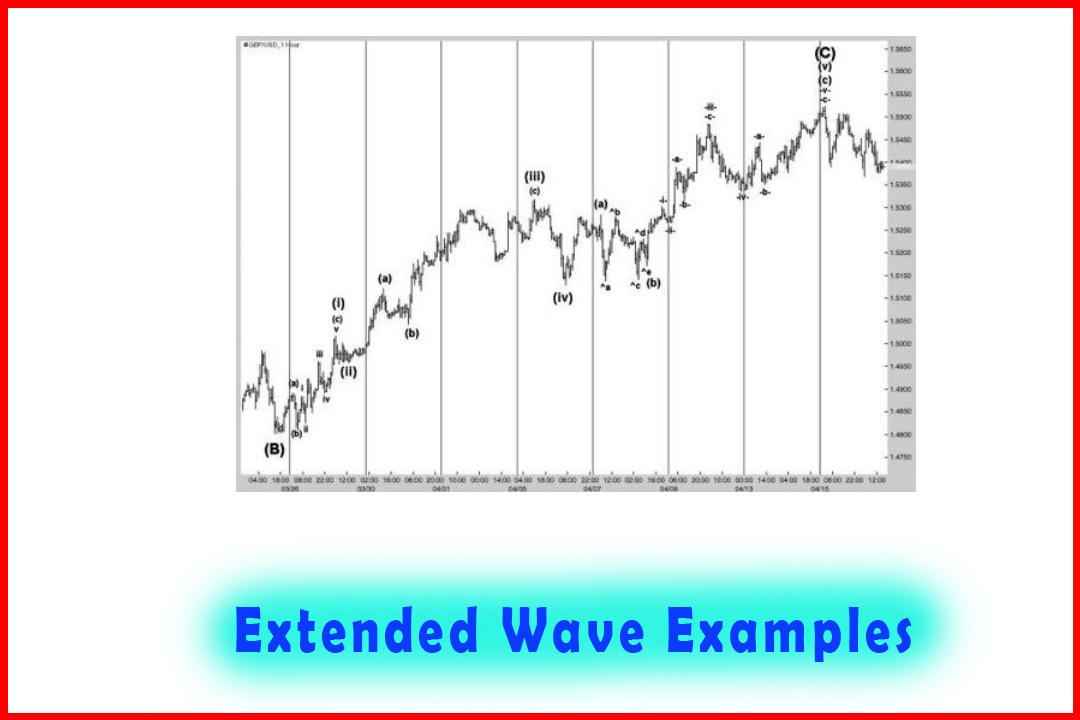
As another example of a deep Wave (b) Figure 4.20 was shown in Chapter 3 in which a Wave (IV) higher was developing in USDCAD
Deep Wave -b-of Wave -iii-in Wave (c) Higher in USDCAD
As
another example of a deep Wave (b) Figure 4.20 was shown in Chapter 3 in which
a Wave (IV) higher was developing in USDCAD. The ratios are quite startling
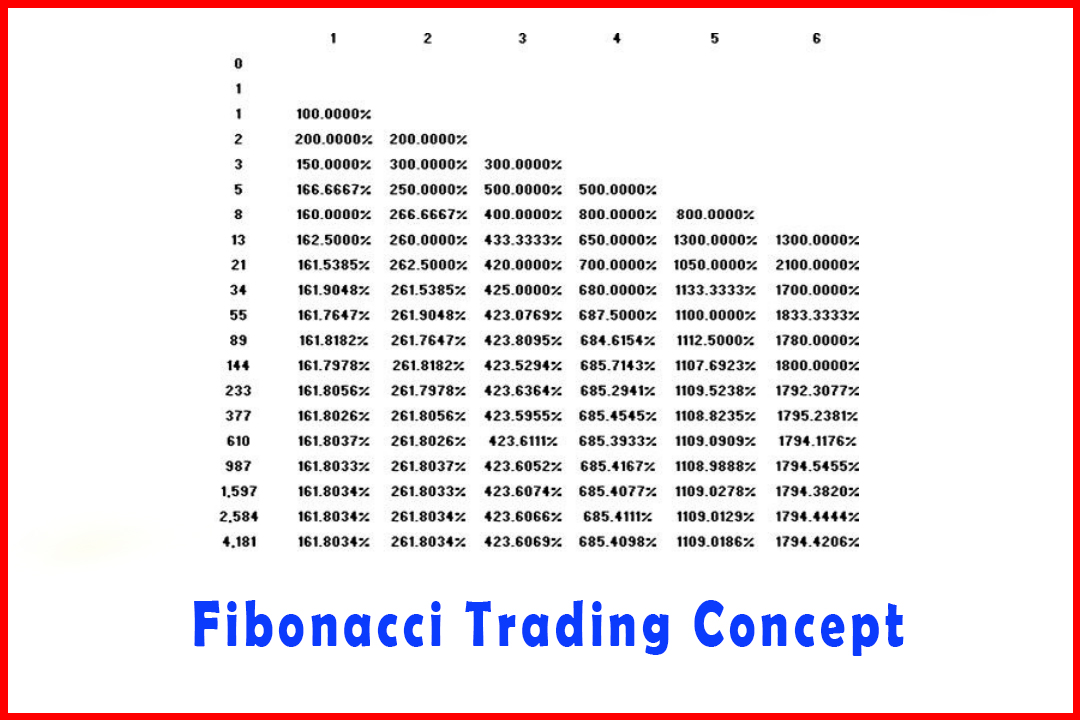
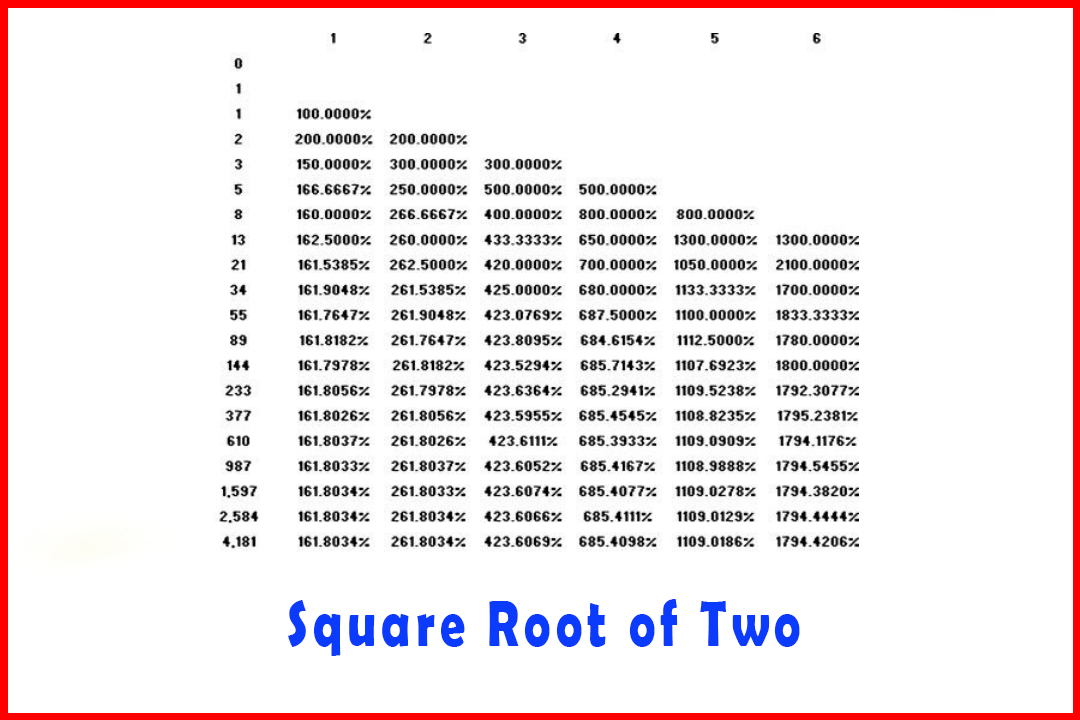
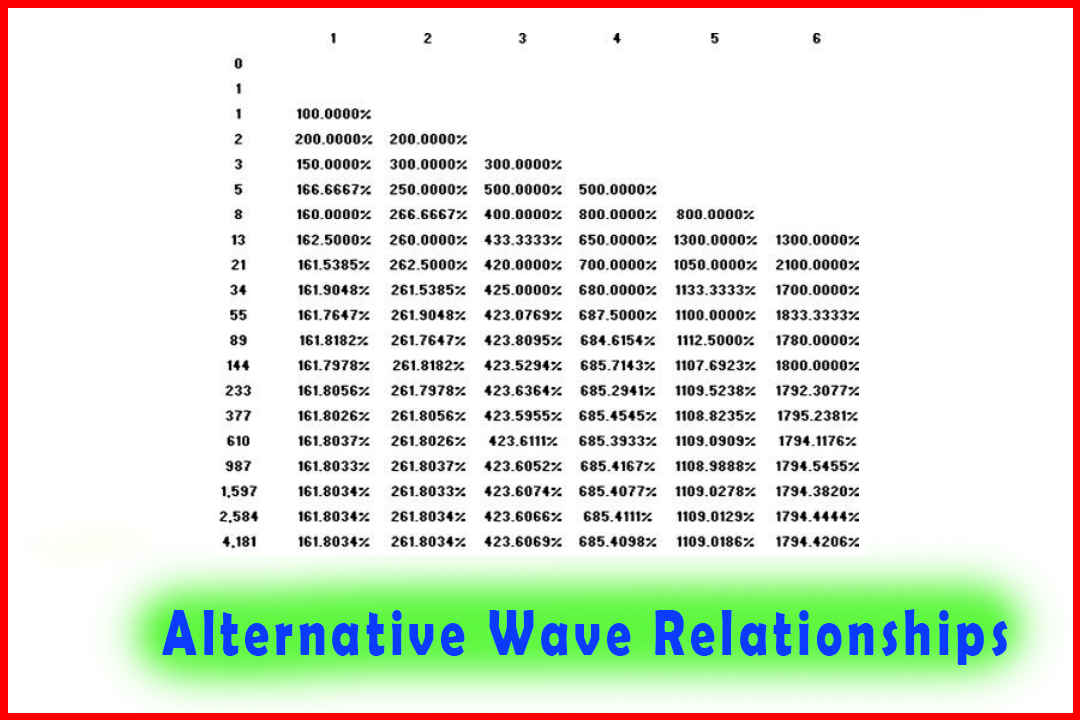
(see Tables 4.15. 4.16. and 4.17).
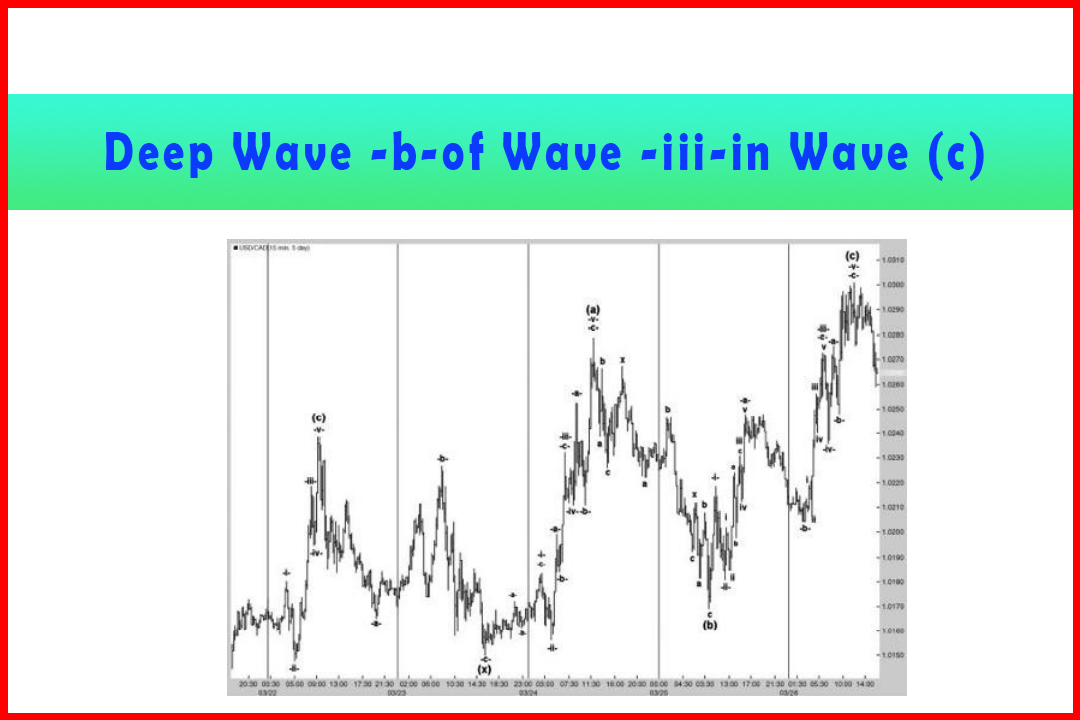
Figure 4.20 A Deep Wave -b-in Wave
-iii-Higher in Wave (c) of Wave (IV) in Hourly USDCAD
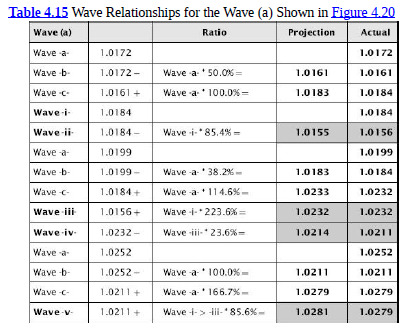
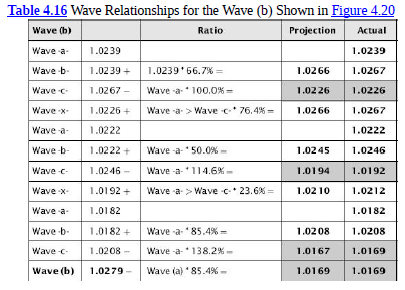
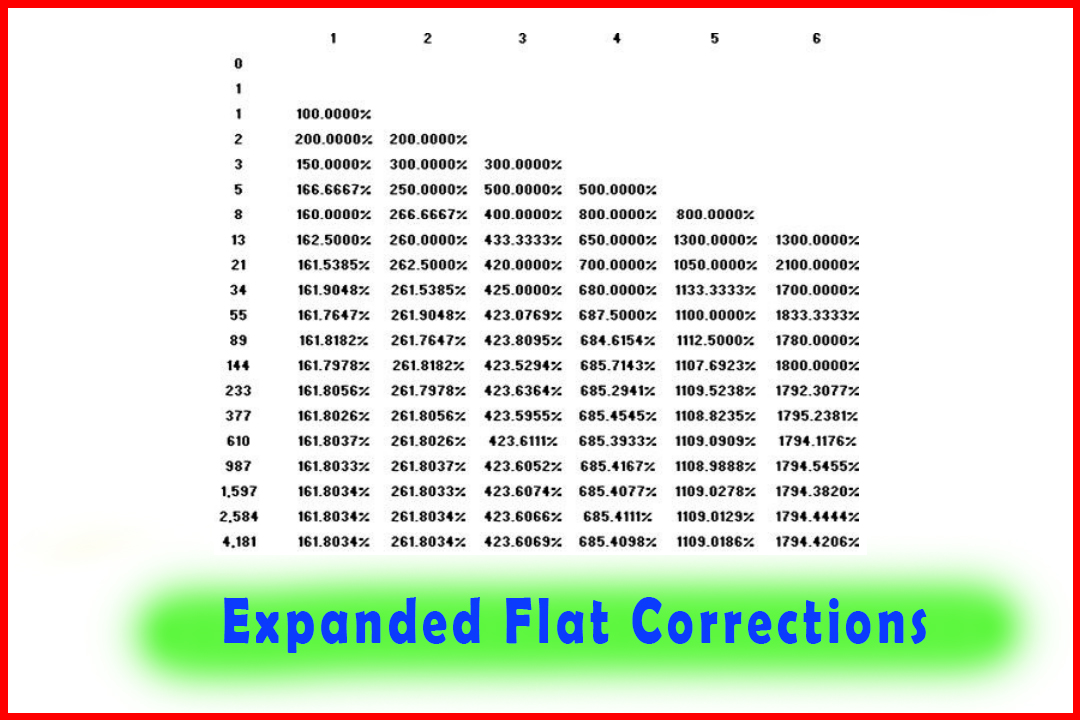
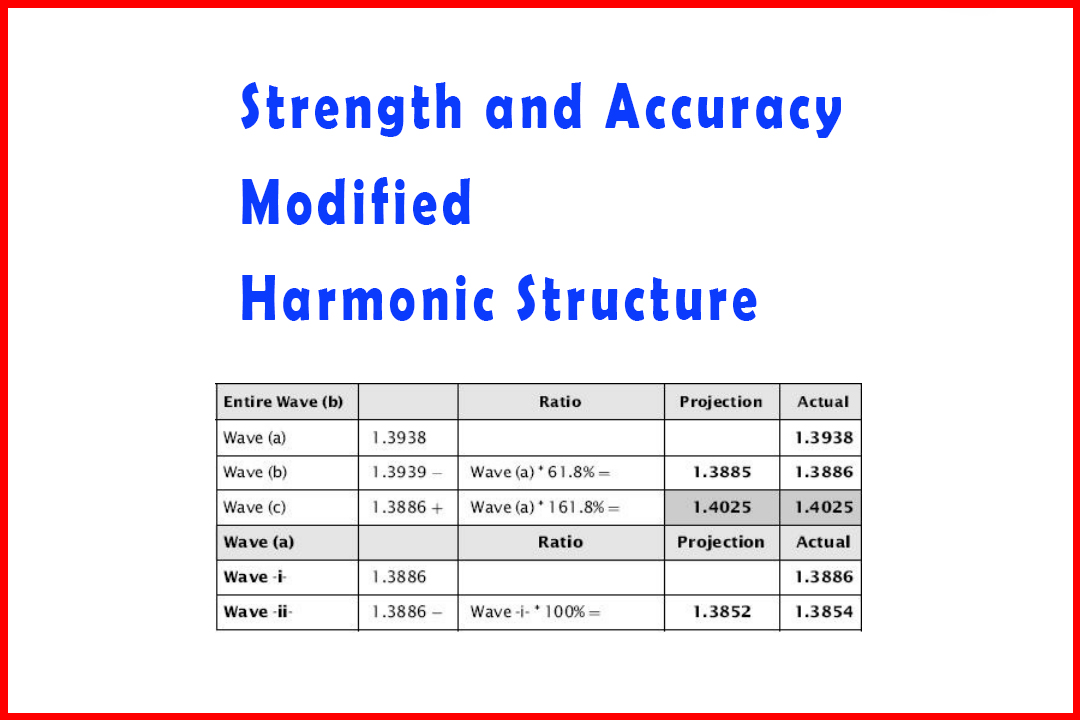
To
highlight the accuracy I shall provide the ratios for Wave (a), Wave (b), and
Wave (c).
This
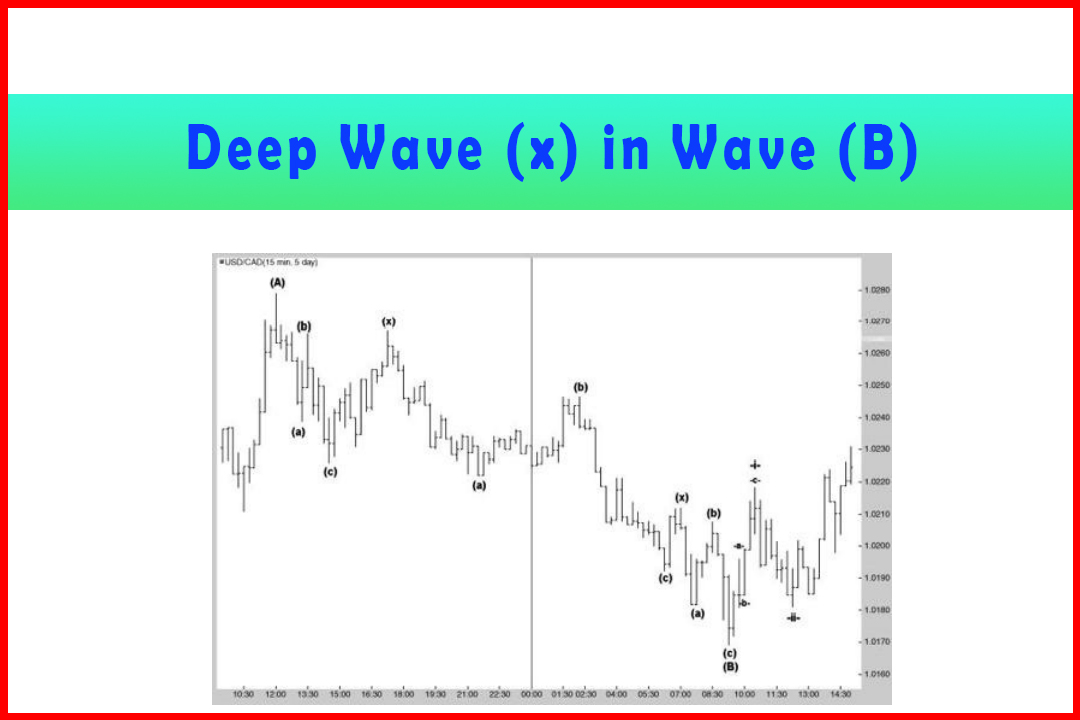
completed Wave (a) from where a pullback in Wave (b) was anticipated. It would
not be possible to know how deep this correction would be. The ratios were
shown in Table 4.14 as an example of a deep Wave (x) following a deep
correction in Wave (b).
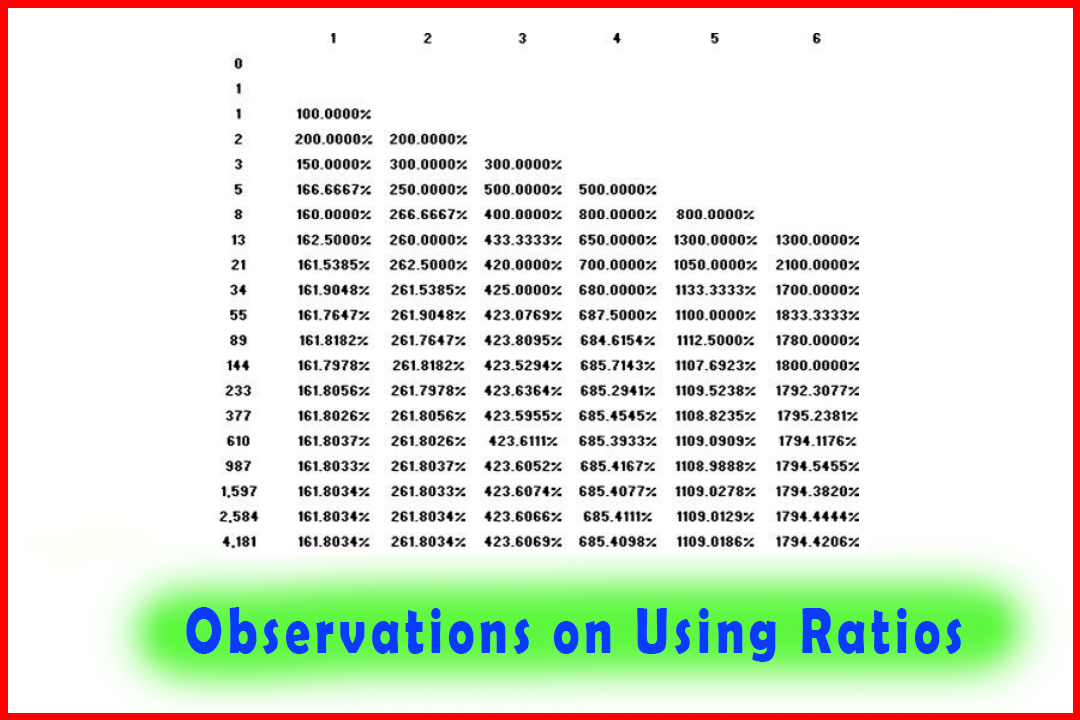
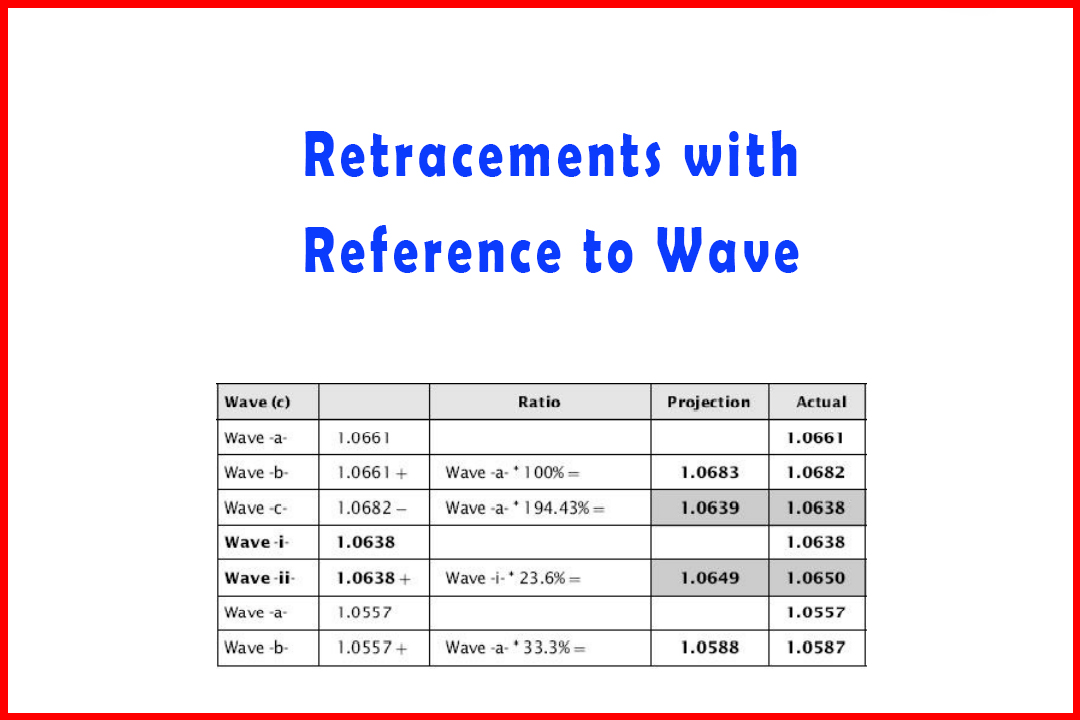
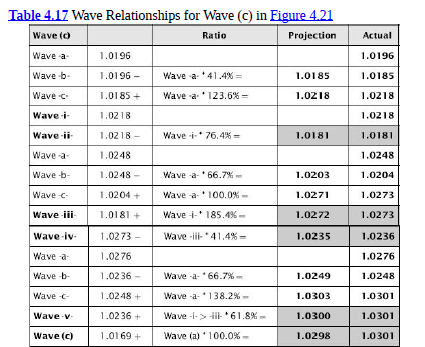
Having
identified the Wave (b) low there would therefore be projections for Wave (c),
and being within a Wave (IV) there would also be ratios for this pullback.
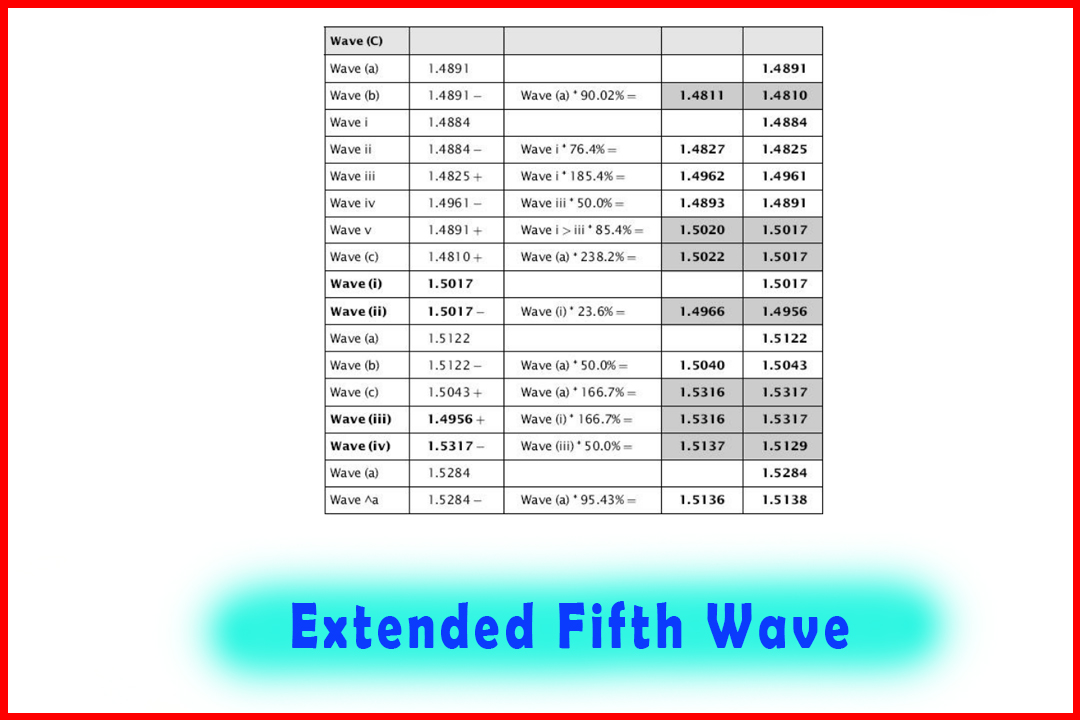
Figure 4.21 displays Wave (c) in more detail.
Figure 4.21 A Deep
Wave -b-in Wave -iii-Higher in Wave (c) in Hourly USDCAD

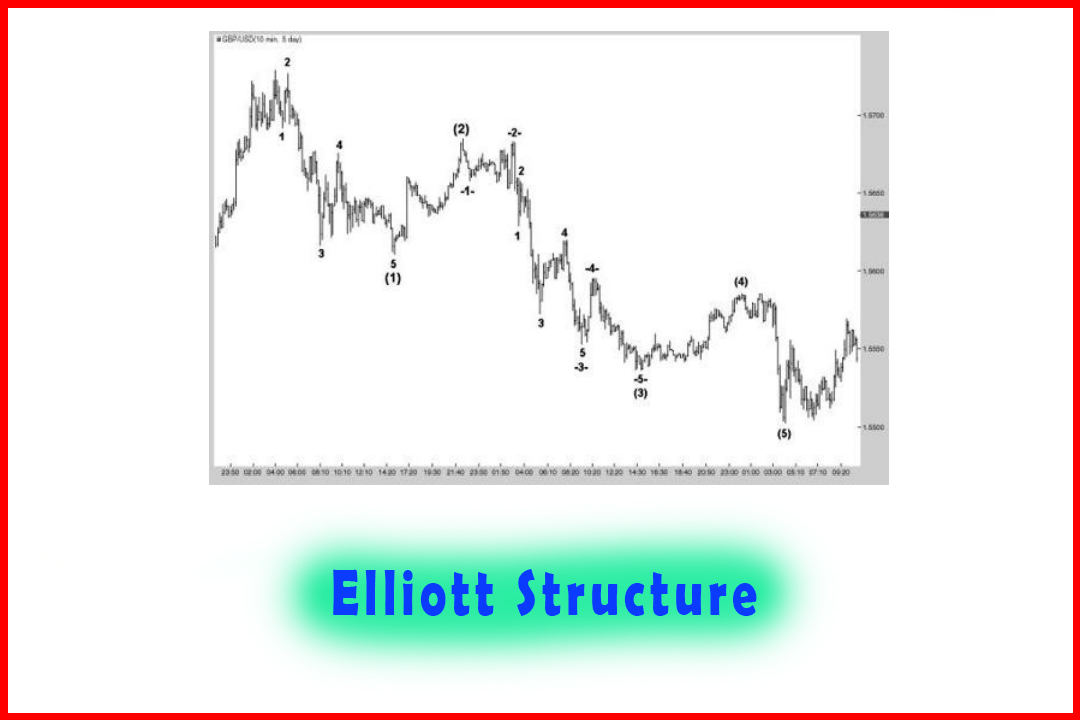
In
Elliott's structure this would not even be considered, as Wave 3 is
generally considered to be the strongest and most powerful wave of the entire
sequence. However, the ratios provide compelling evidence that this is not the
case.
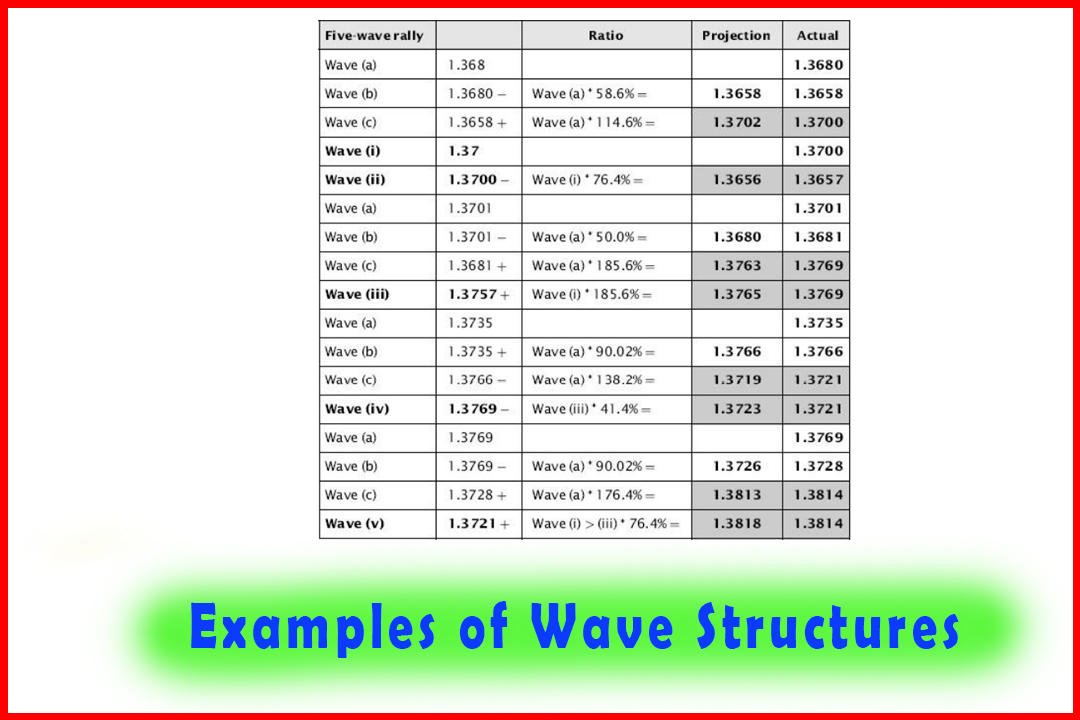
The
key points to note here are:
- The 185.4% projection in Wave -iii-provided a projection target at 1.0272.
- The wave equality target in Wave -c-provided a projection target at 1.0271.
- Given Wave -ii-had a deep retracement of 76.4% the retracement in Wave - iv-of 41.4% was in line with normal ratios.
- The 61.8% projection in Wave -v-arrived at the same area as the wave equality target in Wave (c).
This
is the typical development of a directional move that includes a deep Wave (b),
and demonstrates very clearly the degree of synchronicity that develops within
the Harmonic Elliott Wave structure.
Harmonic Elliott Wave : Chapter 4: Projection and Retracement Ratios : Tag: Elliott Wave, Forex, Fibonacci : Trade retracement, Strength Harmonic Structure, Accuracy Harmonic Structure, Five wave pattern - Deep Wave -b-of Wave -iii-in Wave (c) Higher in USDCAD
Elliott Wave | Forex | Fibonacci |