Funds for Exchanging Trade
Personalized Mini-Mutual Fund, The Birth of ETFs, Hot Sectors, Hot Stocks, Currency ETFs, Commodity ETFs, The Hot Stock
Course: [ The Candlestick and Pivot Point Trading Triggers : Chapter 1. Trading Vehicles, Stock, ETFs, Futures, and Forex ]
Exchange traded funds (ETFs) are listed on different exchanges and are traded on the open market.
EXCHANGE TRADED FUNDS
Exchange
traded funds (ETFs) are listed on different exchanges and are traded on the
open market. Choosing this kind of product allows an investor to select the right
sector of performance, rather than pinpointing an individual stock. The
benefits of trading ETFs compared to a mutual fund are enormous: They allow
diversification; they incur more effective transaction costs; there is pricing
transparency; and they are tax efficient. After all, it is almost impossible
for an individual trader with limited trading re-sources to effectively track
and trade every stock in all sectors of the market. ETFs are index-based
investment vehicles and are traded as a share of a single security based on an
entire portfolio of stocks. The advantage here is that the trader can mix the
benefits of applying technical analysis and fundamental analysis to a
combination of stock and index trading.
In the
most recent development, ETFs have started to include products related to
commodities such as crude oil, gold, and silver; but also they have expanded
into the forex arena by launching a euro currency product.
Personalized Mini-Mutual Fund
Instead
of agonizing over which stock will outperform in a certain sector, you can use
ETFs as an investment vehicle that has certain stocks in a basket as one unit,
listed as a sector fund. This allows individual investors to invest in a group
of stocks in a sector, rather than relying on a mutual fund to do it for them.
Moreover, many mutual funds charge management fees and at times do not fully
invest all an investor’s cash in the market. Because ETFs trade like a stock,
the price of which fluctuates daily, an ETF does not have its net asset value
(NAV) calculated every day like a mutual fund. By owning an ETF, you get the
diversification of an index fund plus the ability to sell short, buy on margin,
and purchase as little as one share.
Another
advantage of an ETF is that the expense ratios for most ETFs are lower than
that of the average mutual fund. When buying and selling ETFs, you have to pay
the same commission to your broker that you’d pay on any regular order. ETFs
allow you to sell without the uptick rule, so you can short right away, even
after the market is in a strong downtrend. You do not have to wait until the
close of the day settlement price as happens in a mutual fund. Another benefit
is the tax consequences because of shielding from capital gains due to the fact
that ETFs do not change holding like a mutual fund does. So purchasing shares
of ETFs is a viable alternative to investing in mutual funds for individual
investors. Keep in mind that many of the ETFs available today have access to
trading options around the ETF. Therefore, you can develop simple or more
complex hedge or spreading strategies tied around an ETF. There are some
negatives, such as the three- day settlement restriction and a bid/ask spread
just like any other market; but the benefits certainly outweigh the negatives, especially
for longer-term swing and position traders.
The Birth of ETFs
The
original ETF was offered to the investing public back in 1993 by the American
Stock Exchange (go to www.amex.com for more listings) and was known as the
SPDRs, which stands for Standard & Poor’s Depositary Receipts and
corresponds with the price movements of the Standard & Poor’s 500.
The more
actively traded and by far more popular ETF came with the QQQs, which directly
correspond with the Nasdaq 100. Then there are the Diamonds, which move in
correlation to the Dow Jones Industrial Average. ETFs have since expanded, and
there is now a new breed of investment vehicles to capture opportunities in
sectors known as HOLDRs. These trading vehicles are based on certain stocks in
a certain sector, known as a basket of diversified stocks in a specific sector.
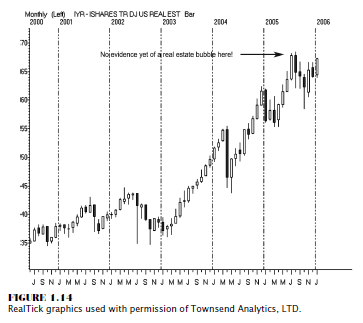
Just as
the examples comparing the U.S. Real Estate Trust (IYR) shown in Figure 1.14 to
Toll Brothers, ETFs can offer investors a relationship to overall sector
performance that is better than outright exposure in just one stock if you are
wrong in your investment decision. As we go forward in the book, I will show
you a technical analysis method such as pivot points using a longer-term time
frame and how it can help you determine entry and exit targets, such as
targeting almost the exact high in Toll Brothers, as well as other stocks.
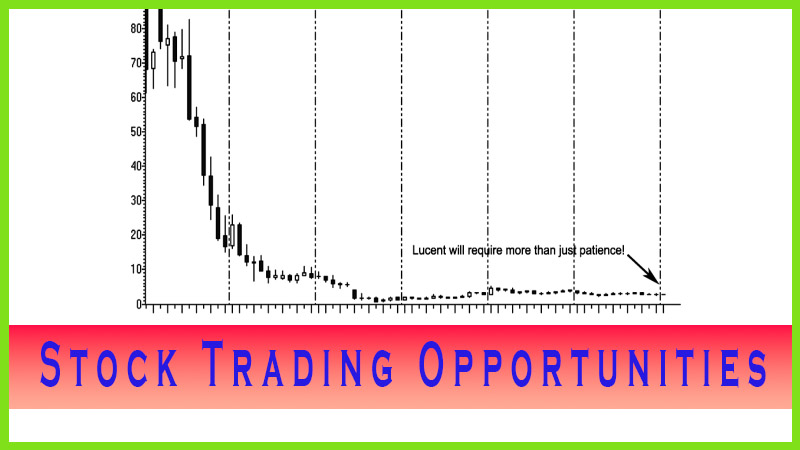
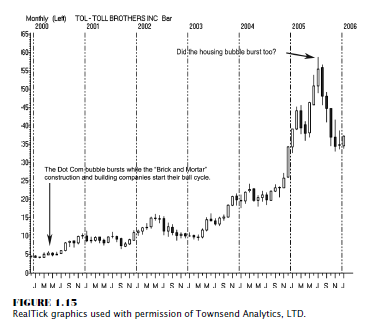
As you
can see in the comparison of the two charts in Figure 1.15, Toll Brothers took
a nasty hit while the Real Estate Investment Trust ETF rebounded from the
correction.
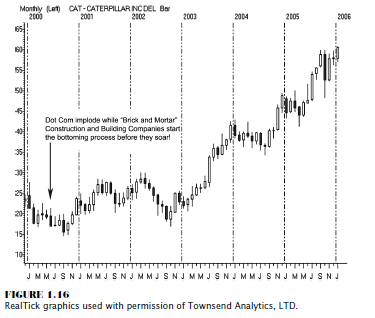
Looking
at a related or similar stock, such as Caterpillar in Figure 1.16, you would
assume that if the construction or housing and real estate markets could
experience a setback due to the 14 interest rate hikes orchestrated by the
Federal Reserve, then a company that manufactures construction and heavy
equipment might suffer a significant correction as well.
However,
that was not the case, as the chart illustrates. In fact, it is quite the
opposite. So by utilizing an ETF and investing in an overall sector, an
investor has a better chance of gaining a better rate of return. By using the
technical analysis methods that will be covered in this book, an investor can
apply those signals to ETF markets. Keep in mind that options will eventually
be available for most ETFs as well. That will offer investors quite an edge as
far as hedging or protecting against adverse market moves, too.
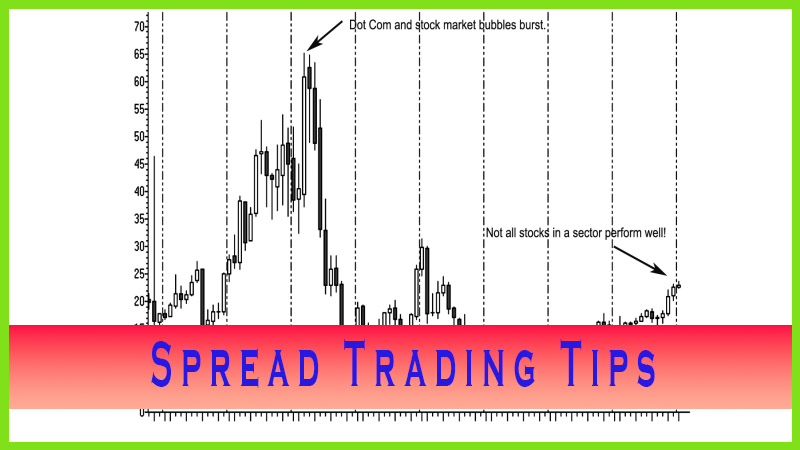
Hot Sectors, Hot Stocks
In order
to take advantage of a hot sector of the market, such as energy, biotechnology,
technology, Internet, brokers, semiconductors, telecom, and cyclical, to name a
few, how would an investor identify the best stocks in that sector and then
narrow it down to one or two stocks and be right? That is generally the tough part
of investing. Trading an ETF or a HOLDR can help remove that difficulty and may
help a longer-term investor achieve that goal. Moreover, it can also allow an
individual to literally trade like a hedge fund through means of diversified sectors
and allow for implementing simple to sophisticated trading strategies
integrating options as stated earlier.
With
market liquidity and market transparency, traders using ETFs can buy or sell at
current market values rather than at assigned market values based on the close,
as is the case when investing in mutual funds. In fact, some mutual funds may
not be fully vested in stocks at a given time. This means your cash may not be
working at 100 percent capacity.
Currency ETFs
This book will also reveal more about
the forex markets or foreign currency trading. And on that subject, there was a
new ETF that may appeal to those who want to participate in currency investing
but have neither the time capacity nor the desire for excessive leverage
exposure. Rydex Investments launched the first-ever currency-based
exchange-traded product back in December 2005.
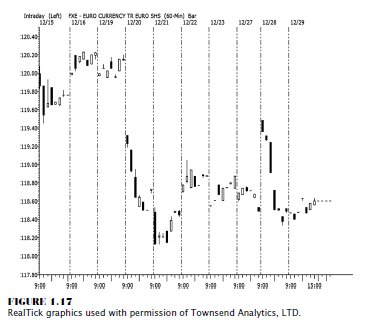
The Euro
Currency Trust (FXE) is an ETF that tracks the price of the euro, with each
share representing about 100 euros plus accrued interest. Shares of the trust,
called “Euro Currency shares,” trade on the New York
Stock
Exchange (NYSE). The ETF has a 0.4 percent annual fee. Investors generally pay
commissions to buy and sell ETFs, which trade daily on exchanges as stocks do.
Initially, the trust registered 17 million Euro Currency shares, for a total
offering price of about $2 billion. Shares of the ETF can be sold short and are
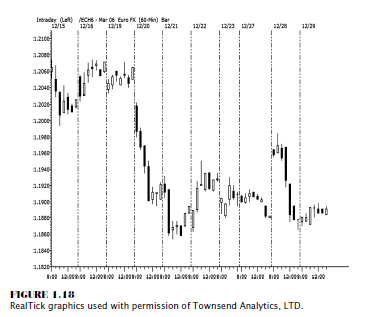
eligible for margin, as most ETFs are. Notice the correlation of price movement
in the ETF shown in Figure 1.17 with the euro FX currency futures contract
shown in Figure 1.18.
Granted
there is more liquidity in the price of the euro futures contract; but keep in
mind the that the euro ETF was in its third week of trading after its initial
launch date. I suspect that by the time this book is published, the volume and
liquidity will improve dramatically.
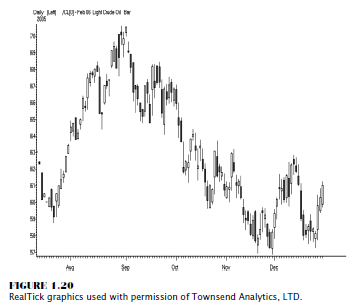
Commodity ETFs
Not all
ETFs track the price movement of the underlying derivative market exactly. Take
for example the OIH chart shown in Figure 1.19. As you compare moves in the underlying
commodity of crude oil, as shown in Figure 1.20, you will see that at times the
correlation is not 100 percent exact.
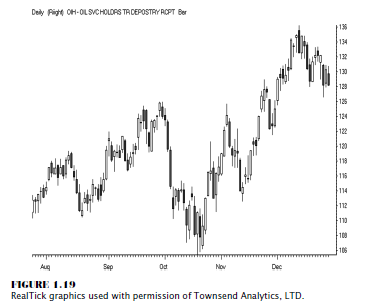
In fact,
at times the ETF has actually been a leading price indicator of the underlying
commodity price move! Now there is an ETF that is more closely correlated to
crude oil, such as the United States Oil Fund (USO).
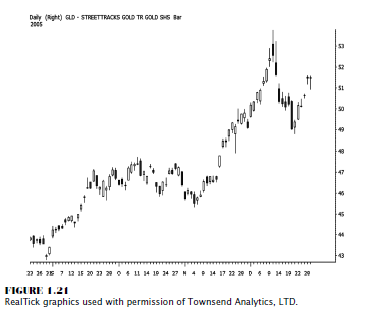
The
example in Figure 1.21 is street TRACKS Gold ETF, traded on the NYSE. It was
launched in late 2004; and as of December 2005, when I started writing this
book, it was trading roughly 2.1 million shares a day. It has attracted $5.65
billion from investors. Each share of the ETF represents one-tenth of an ounce
of gold, which allows mutual funds or private investors to invest in gold
without actually owning the metal. It mirrors or tracks the price movement of
gold almost exactly, as you can see from Figure 1.21 when compared to the gold
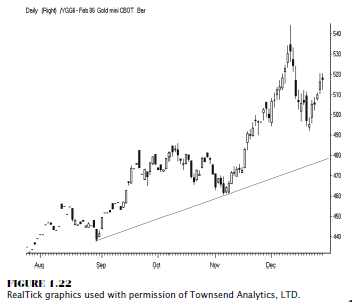
futures chart in Figure 1.22.
The
objective of the trust is for the value of its shares to reflect at any given
time the price of gold owned by the trust at that time, minus the trust’s
expenses and liabilities. The trust is not actively managed. It receives gold
deposited with it in exchange for the creation of baskets of iShares. The trust
sells gold as necessary to cover the trust’s liabilities, and it delivers gold
in exchange for baskets of iShares surrendered to it for redemption.
The trust
is not an investment company registered under the Investment Company Act of
1940 nor a commodity pool for purposes of the Commodity Exchange Act. This is
traded on the American Stock Exchange (AMEX).
Figure
1.22 shows the CBOT gold mini contract; and as you can see as you compare the
two charts, the price movement in the gold ETF shown in Figure 1.21 mirrors
almost exactly the price movement in the gold futures contract.
For
silver bulls, bears, or spread traders, the newest ETF addition was the AMEX
iShares Silver Trust (SLV). It is a fund based on the daily price of one ounce
of silver as set by the London Bullion Market Association. Those spread traders
buying gold or selling silver now can use ETFs. The key in showing you the
various markets as compared to the ETFs is that you realize that once you
identify the opportunity, you then can make a good decision on which
opportunity best presents itself. While futures offer the leverage, you may
want to invest longer term; and an ETF would be right up your alley without
having to pick a gold or silver mining stock. If you are bullish on precious
metals but don’t want to buy the physical metal and if you have the luxury to
trade options, then an ETF would be the right choice.
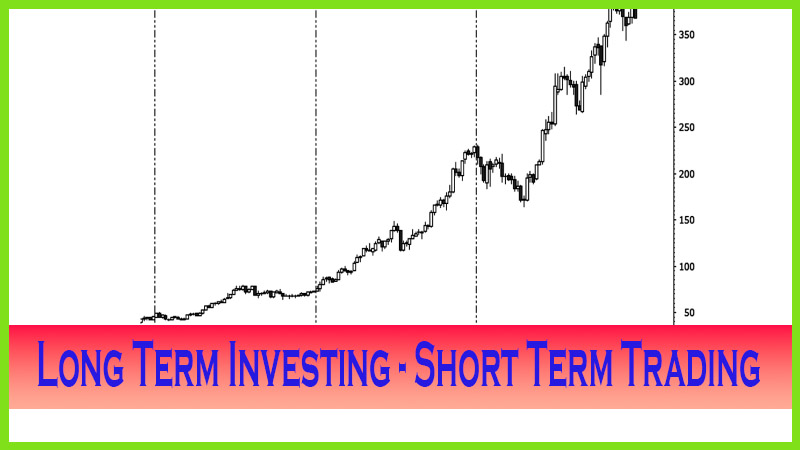
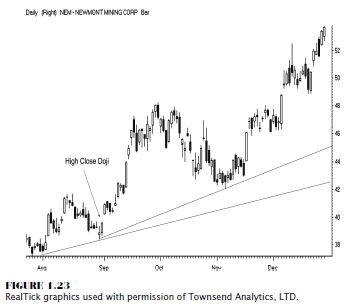
It does
not go without saying that an outright stock selection can provide a great
return and can at times outperform the sector and even the underlying market.
Look at the price move for Newmont Mining in Figure 1.23. This stock took off
and never looked back, even when the price of gold and the gold ETF made a
price correction. There are times when that can happen. Even if you were to
purchase long call options, the most profitable rate of return comes from the
leverage of an outright long call option position in a straight up move, such
as Newmont experienced. The question is how many times can that trade and, more
important, the timing of such an event be replicated.
Another
advantage of an ETF is the availability and structured use of iShares. If you
are trying to match the most liquid investment vehicle with a specific sector
or group of like stocks, this may be the right investment choice. IShares are
considered to be like an open-ended mutual fund that reinvests dividends. This
investment class is always fully invested in the market; so when the market
moves up and you are long, you would fully benefit. These index funds also
trade just like stocks. Each fund share represents a proportion of ownership in
each stock that makes up the index. As we have briefly discussed, to make the
right choice in an investment and choose the right stock, you can utilize
fundamental analysis, such as earnings per share and market capitalization, to
determine what the potential futures earnings might be. This data can help you
determine if the stock is ripe as a buying opportunity or if the price is too
high or overvalued and should be avoided.
Considerations
that can never be determined are the hidden demand for a company’s product and
the way the company is run, to see if the profit margins are high or if
operating costs and deep discounts to retailers cut into the company’s bottom
line. Therefore, it could be prudent to possibly play the sector through an
ETF, which effectively would eliminate the issue of selecting the wrong stock
or the underperformer of that specific sector.
The Hot Stock
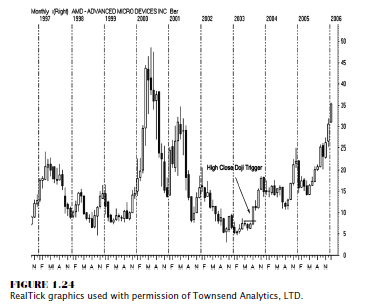
Take, for
example, one of the most amazing come-from-behind stories in 2005 and early
2006. Advance Micro Devices (AMD) triumphed, surpassing Intel’s price level. It
would have taken patience and discipline to stick with this winner; but
outperform it did, and what a hot stock it was, as the chart shows in Figure
1.24!
For a
specific ETF or iShare that would list AMD and Intel, you would look at the
iShares Goldman Sachs Semiconductor (IGW) listing. The top 10 holdings as of
12/31/2005 were Texas Instruments, Intel, Motorola, Applied Materials,
STMicroelectronics NV, Marvell, Technology Analog Devices, Broadcom, Advanced
Micro Devices, and Maxim Integrated Products.
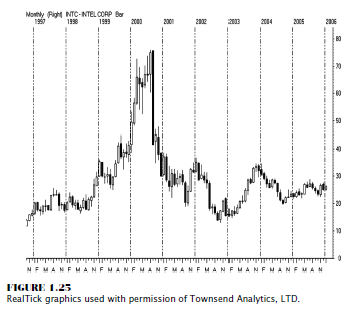
Intel was
a darling among institutional traders and mutual funds, but it had not
performed well, let alone offered enough volatility to day trade or even swing
trade a position. There was just not enough movement in this stock, as Figure
1.25 shows.
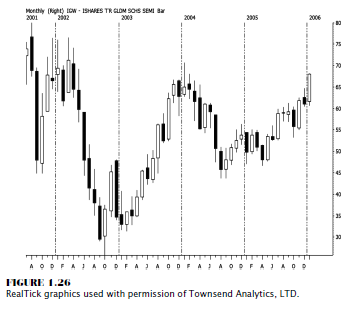
So how
was an investor to make money, and how would one possibly choose to invest in
AMD instead of Intel? Actually, once a few simple concepts of identifying
market price momentum through candle charts are covered in the next few
chapters, you will see how and why to stick around when a market goes into a
trending phase. Also, once you learn these techniques, it will be pretty easy
to help select the right stock. Another simple investment decision would be to
buy the iShares Goldman Sachs Semiconductor ETF! As you can see from Figure
1.26, the semiconductor ETF moved up. It would have been a far better trade
simply being outright long AMD from under 15 in March 2005, but the torture of
watching Intel go nowhere would have been a reason to buy the semiconductor ETF
and participate in a profit.
The key
in using these vehicles is for those who like a specific sector and do not have
unlimited resources to buy a wide spectrum of stocks. It is also appealing to
those who want longer-term trades and who hold a regular day job and cannot day
trade for a living, at least not yet.
Once
again, the difficulty of choosing the right stock in a competitive industry in
a specific sector can be overcome; and it may be more profitable by considering
trading an ETF. The previous comparisons of Best Buy and Circuit City, Dell and
Apple, and AMD and Intel all are excellent examples of how an investor may have
a difficult time anticipating which stock outperforms another in a specific
sector. Therefore, for a longer-term stock trader, ETF investment vehicles
could be a solution, helping to boost the bottom line, and can be added to his
or her investment portfolio.
ETFs and
some HOLDRs have the greater advantage of trading put and call options within a
prescribed period of time. An investor can even buy calls such as on the
pharmaceutical HOLDRs. Here is a tactic that I have used before with some
success, especially if there are buy signals on several individual stocks
within a sector. Go ahead and purchase, with a reasonable time until
expiration, an in-the-money or close-to-the-money call option on the HOLDR
itself. The pharmaceutical HOLDRs can be traded based on signals from Abbott,
Merck, and Pfizer.
So you
can utilize ETFs and their respected relatives and apply several strategies;
also you can use intermarket relationships to determine buy or sell signals and
devise a trading strategy dependent on those signals. Once you have a good feel
for a stock that correlates or links best with an ETF, then you can use a
spread or “pairs” trading strategy or even a hedge strategy using options.
Deciding what is best for your risk capital making, using an ETF, you no longer
need to make a precise pick for a stock in a specific sector.
In
conclusion, trading opportunities exist in these investment vehicles for all
investors; and best of all, they respond quite well using technical analysis to
project support and resistance levels as derived from pivot point analysis and
the momentum techniques that certain candle patterns indicate, which are the
specific techniques disclosed in this book. This knowledge should give you, the
individual investor, quite an edge in the market!
The Candlestick and Pivot Point Trading Triggers : Chapter 1. Trading Vehicles, Stock, ETFs, Futures, and Forex : Tag: Candlestick Trading, Stock Markets, Pivot Point : Personalized Mini-Mutual Fund, The Birth of ETFs, Hot Sectors, Hot Stocks, Currency ETFs, Commodity ETFs, The Hot Stock - Funds for Exchanging Trade