Leverage System in Future Markets
Stock Index Futures, Tandem Trading Techniques, A Case in Point
Course: [ The Candlestick and Pivot Point Trading Triggers : Chapter 1. Trading Vehicles, Stock, ETFs, Futures, and Forex ]
We will go over several techniques for helping you identify trading opportunities in the futures markets. So far we have gone over using exchange traded funds versus stocks; pairs trading in related stocks; and using commodities for identifying opportunities in ETFs, such as the oil service.
FUTURES MARKETS: LEVERAGE SYSTEM
We
will go over several techniques for helping you identify trading opportunities
in the futures markets. So far we have gone over using exchange traded funds
versus stocks; pairs trading in related stocks; and using commodities for
identifying opportunities in ETFs, such as the oil service.
HOLDRs
(OIH) or the U.S. Oil Fund (USO) versus crude oil futures. The Euro Currency
Trust (FXE) is a more direct move for stock traders playing the euro currency
futures versus the U.S. dollar. Then there is the street- TRACKS Gold ETF (GLD)
compared to the CBOT electronic gold futures contract, or now a trader can use
the iShares Silver Trust to trade against the physical silver market.
Stock
traders can now apply and take advantage of so many commodity markets; but as I
mentioned, the futures market is a great investment vehicle to many savvy and
financially well-funded traders. Even smaller-sized traders can benefit from
trading the futures market through the responsible use of the margin system,
otherwise referred to as a “good faith deposit.” What is a futures contract? It
is a legally binding agreement to buy and sell a commodity or financial
instrument sometime in the future at a price agreed upon at the time a
transaction was made. Contracts are standardized according to delivery points
of interest, quality, quantity, and time of accepting or making a delivery. It
is estimated that less than 3 percent of all transactions actually result in a
delivery. In the case of stock index trading, there is a cash settlement over
the value of the contract.
Stock Index Futures
For day
or swing traders following the stock market, the futures market offers an
advantage over stocks from tax liability perspective. Always check with your
accountant; but, generally speaking, profits generated in a futures account are
taxed at a rate significantly lower than that for a stock account.
One
confusing aspect and perhaps a drawback for many traders switching from
equities or even forex to trading futures is that there are so many products
with various contract sizes. There is no consistency or constant in tick value
fluctuations or dollar value in the price changes. For example, the CBOT
mini-Dow contract is $5 times the overall Index. When the Dow was at 10,500,
the overall value was 52,500. The margin was set at $2,600, or just under 5
percent. E-mini-S&Ps are 12.50 per tick (four ticks per point). If the
point value is $50, the overall value of the contract if the S&P is at
1,200.00 is $60,000. In the currency markets, the euro is 12.50 per tick; the
Canadian dollar is 10 per tick; the British pound is 6.25 per point but trades
in a minimum two-tick fluctuation. (In my first book [A Complete Guide to
Trading Tactics, Wiley, 2004], I listed all the commodities and the contract
sizes on pages 8 and 9; please refer to that for a comparison. Or you can ask
your futures broker to provide the listing of contract specifications.)
The
exchanges where the individual futures products are traded set the margin
requirements. Generally speaking, an initial margin requirement on a futures
product runs anywhere from 2 percent up to 10 percent of a contract’s overall
value. So now a trader needs to know which exchange the product is traded on,
how much risk capital is needed to invest per contract, and how much each point
value is. Let’s look at the New York Mercantile Exchange’s crude oil contract:
The contract size is 1,000 gallons; every tick or point fluctuation equals $10.
A $1 move per contract is a $1,000 price move. When prices were at $65 per
barrel, the contract value was $65,000. The margin requirement was, at one
point, nearly $9,000 per contract, almost 14 percent of the overall market
value. The extremely high margin requirement reflected the extreme level of
volatility and the inherent risk associated with that increased volatility.
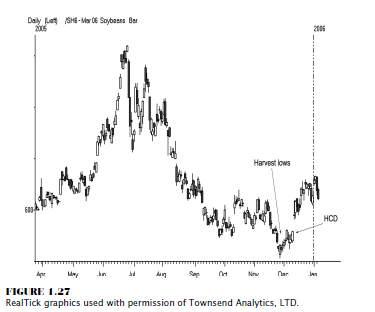
The
futures markets also have a value for stock traders to make decisions on asset
allocations to their stock portfolios. In the agriculture sector, for example,
you can study the price direction of soybeans, use traditional technical
analysis tactics to determine the strength of a trend, and see if corresponding
stocks linked to that market are worth switching or allocating funds toward. In
Figure 1.27, we see soybeans making a seasonal harvest bottom at the end of
November.
Another
advantage futures have is that you can trade signals to diversify in other
investments. Anticipating that the market may establish a seasonal bottom, you
may want to explore stocks directly linked to the agriculture industry, instead
of being exposed to potential risks due to what might appear to be an
overleveraged investment vehicle, such as a futures contract. After all, every
penny in soybean futures was $50 at the time that I was preparing this book,
and the minimum margin requirement was $1,148. That means that on a small 20
cent move, you could lose nearly 95 percent of the initial investment per
contract.
There are
other considerations you could use, such as an options strategy, to effectively
reduce risk exposure, such as going long a futures contract and buying a put
option for protection; but in this strategy, you need to time the right option
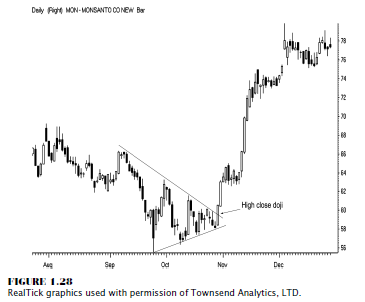
expiration. An alternative strategy would be going long a related market, such
as stock in Monsanto shown in Figure 1.28.
Notice
that this stock exploded in early November. The best part here is that there
were seasonal factors to support a buy signal; and the technical picture shows
what I call a “high close doji trigger,” which we will disclose in this book.
In fact, this is a great example to demonstrate why using a like or related
market analysis approach can help you achieve better results in your trading.
Cycle and seasonal studies can really help you in selecting stocks. The futures
markets can certainly aid in that analytical process. Not only do commodities
move in cycles, but the economy and businesses do as well.
There is
one man who sticks out above the rest as the premier expert in the field of
intermarket relationships—John J. Murphy. He has written many books on the
subject; the latest, titled Intermarket Analysis: Profiting from Global Market
Relationships, will really help you in your educational journey.
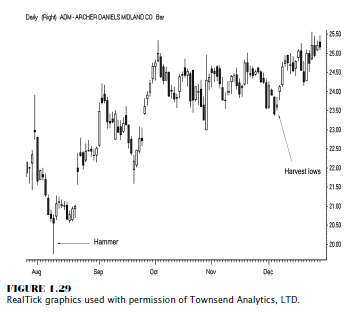
Let’s
look at two more agriculture related stocks: One in Figure 1.29 is Archer
Daniels Midland, which as you can see did rise but not significantly; however,
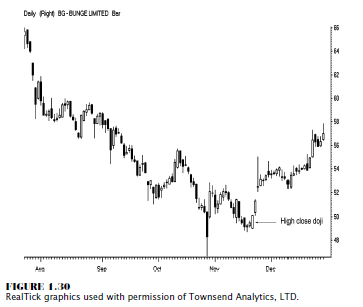
it did rise in tandem with the soybean market. The other stock is Bunge
Limited, shown in Figure 1.30, which mirrored the chart pattern in Figure 1.29
and moved higher at almost exactly the same time that the bottom in the soybean
futures was formed.
Tandem Trading Techniques
Intermarket
relationships have existed for years. It is very easy to track and look for
trade setups in futures from a historical perspective, but timing a trade can
be difficult due to the magnitude of the leverage as previously discussed.
Don’t get me wrong; futures are a very viable investment vehicle. I have made a
very lucrative living trading commodities for the past 26 years. I just want
you to learn that you can use futures to help make diversified investment
decisions on a broader scale.
The key
to making money in the markets is managing risk . . . end of story. Knowing the
right strategy and having exposure to other markets and strategies can help you
achieve your financial goals. Using similar or like markets or those that trade
in tandem, especially markets that have strong relationships, traders can
develop trading techniques or strategies by using signals based on one market
and applying them to another, such as commodities and stocks or an ETF. Keep in
mind that not all relationships work all the time. Look at past market
relationships, such as the dollar and gold: Generally when the dollar goes up,
gold goes down; but that certainly was not the case in 2005. How about when the
Fed raises interest rates? Generally, long-term bond yields rise as well; but
that did not occur in 2005 either. In fact, commodities and bond yields usually
trend together; and that did not occur in 2005. Federal Reserve chairman Alan
Greenspan called the decline in long-term yields a “conundrum.”
As we saw
commodity prices rise, we saw the Federal Reserve raise rates at a “moderate”
pace, acting at 16 consecutive meetings to adjust the Fed funds rate by 0.25
percent each time. This was in response to the perception that inflation was
rearing its ugly head. (As of the printing of this book, the Fed was still in
rate-hiking mode!) Due to higher energy costs and as reflected in the Producer
and Consumer Price Indexes, we had seen a pickup in inflation; and historically,
many commodity prices rise besides gold and silver, such as sugar, coffee, and
cotton.
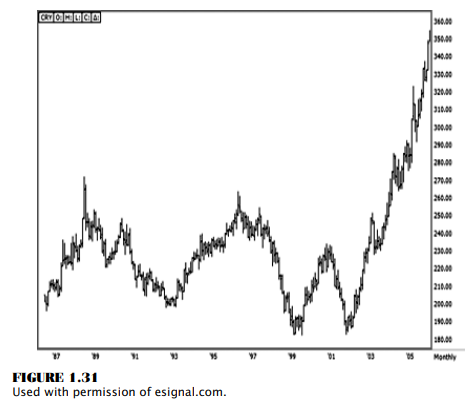
The
Reuters/Jefferies CRB (Commodity Research Bureau) Index, originally developed
in 1957, is one of the most often cited indicators of overall commodity prices,
offering investors a broad and reliable benchmark for the performance of the
commodity sector. It is traded on the New York Board of Trade and started
trading back in 1986. The “RJ/CRB” Index was revised in 2005 to reflect 19
commodity futures prices: aluminum, cocoa, coffee, copper, corn, cotton, crude
oil, gold, heating oil, live cattle, lean hogs, natural gas, nickel, orange
juice, silver, soybeans, sugar, unleaded gasoline, and wheat.
If you
examine the chart of the RJ/CRB Index shown in Figure 1.31, the stratospheric
rise is obvious and would indicate that inflation was or will be trickling down
to consumers.
Again,
price increases in commodities historically signal a rise in inflationary
pressures.
Investors
and traders can use stocks or ETFs to capitalize on commodity plays; but at
times, it pays to diversify and have a commodity account. Not all stocks offer
participation in all commodity moves, so it is wise to explore using commodity
markets as an investment.
A Case In Point
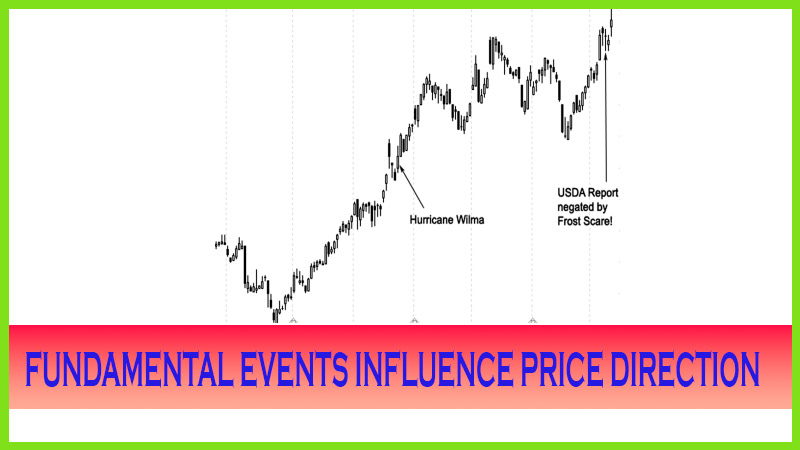
A
fundamental event, besides an increase in demand, that helped create a shortage
of supplies in energy and other commodities in 2005 was the weather. Hurricanes
Katrina, Rita, and Wilma gave a lift to sugar and orange juice futures while
harming certified coffee facilities in New Orleans and, to a lesser extent,
Miami. These weather-related events were pure commodity market plays. Let me
walk you through one of these 2005 events: The day before Hurricane Wilma
passed through Florida, my wife and I had watched the Weather Channel intensely
and decided to stick around because all the news reported that the hurricane
would be downgraded to a tropical depression by the time it crossed over Naples
and exited on the other side of Florida, in Palm Beach. The day before, we had
played golf; and it was a splendid day: 83 degrees or so, a light breeze, and
not a cloud in the sky. We were planning to leave for Chicago the following
Sunday, and we could have easily changed our tickets and left early. Well, at 6
a.m. on October 24, we woke up and discovered that Wilma had gained strength
and merged with another storm, named Alpha; and Wilma had turned into a
low-grade Category 3 hurricane! All I could think of at the moment my wife
turned the TV on was, “I better make some coffee because we are going to lose
power.” By the time the coffee had finished brewing, click, all the lights went
out.
However,
we were prepared: The cars had gas, the shutters were up, and we had a
generator; so life was not so bad for that week. The morning of the hurricane,
CNBC had called to see if I was in Florida and asked me what I thought would
happen to the orange juice crop. I did a live interview via my cell phone,
reporting on the weather conditions and what might happen to the orange crop. I
stated that “we could see at least a 10 percent price gain from the 1.11 level
to possibly as high as 1.25, as the storm would pass through sections of Indian
River County.” It was also that storm that devastated the soon-to-be-harvested
sugar cane crop. As it turns out, that was a solid prediction and exactly what
played out in the markets. If you had a commodity account, you may have taken
up that opportunity in orange juice. In fact, orange juice eventually moved as
high as 164 by May 11, 2006.
The Candlestick and Pivot Point Trading Triggers : Chapter 1. Trading Vehicles, Stock, ETFs, Futures, and Forex : Tag: Candlestick Trading, Stock Markets, Pivot Point : Stock Index Futures, Tandem Trading Techniques, A Case in Point - Leverage System in Future Markets