Benefits of Forex Traders from Future Markets
benefits of being a forex trader, is forex trading good for beginners, how much do forex traders make a day
Course: [ The Candlestick and Pivot Point Trading Triggers : Chapter 1. Trading Vehicles, Stock, ETFs, Futures, and Forex ]
Forex traders can integrate futures data to help in trading decisions, such as taking a trading signal based on chart patterns in the futures and translating it into a trading trigger signal in a forex market.
FOREX TRADERS BENEFIT FROM FUTURES MARKETS INFO
Forex traders can integrate futures data to help in trading
decisions, such as taking a trading signal based on chart patterns in the
futures and translating it into a trading trigger signal in a forex market.
Because spot FX and futures trade in tandem, the price difference is called the
basis. Generally, day-to-day, they are geometrically equal (within a few PIPs).
Since, as we discussed, forex markets are decentralized, there is not a
collective database to measure two distinct studies, such as volume and open
interest. These are important tools, so let’s review what the basics are and
how a forex trader can use this futures information.
Volume is
the number of trades for the total contract months of a given future’s
contract, both long and short combined. For example, the futures foreign
currency markets trade on quarterly expirations—the March, June, September, and
December contract months. The volume will represent the total for all the
trades in each contract month. Most technical analysts believe that volume is
an indicator of the strength of a market trend. It is also a relative measure
of the dominant behavior of the market. A further ex-planation is that volume
is the measurement of the market’s acceptance or rejection of price at a
specific level and time. There are several theories and so-called rules when
using volume analysis on price charts: First, if a market is increasing in
price and the volume is increasing, the market is said to be in a bullish mode
and can indicate further price increases. Second, the exact opposite is true
for a declining market. If price is declining and volume increases, it is said
to be in a bearish mode and indicates further price decreases. However, if a
substantial daily market price increase or decrease occurs after a long steady
uptrend or downtrend, especially on unusually high daily volume, the move is
considered to be a “blow-off-top or bottom exhaustion” and can signal a market
turning point or a trend reversal. Here are some guidelines to use when using
volume analysis.
- Increasing volume in a rising price environment signals excessive buying pressure and could lead to substantial advances.
- Increasing volume while prices are falling may signal a bear move.
- Decreasing volume while prices are climbing may indicate a plateau and can be used to predict a reversal.
- Decreasing volume with a weaker price environment shows that fresh sellers are reluctant to enter the market and could be a sign of a future downtrend.
- Excessive volume while prices are high indicates that traders are selling into strength and often creates a price ceiling.
- Excessively low volume while prices are low indicates that traders are buying on weakness and often creates a floor.
Open
interest reveals the total amount of open positions that are outstanding in
existence and not offset or delivered upon. Remember that in futures trading,
this is a zero-sum game so that for every long there is a short or for every
buyer there is a seller. The open interest figure represents the longs or
shorts but not the total of both. So when examining open interest, the theory
or general guidelines are that when prices rise and open interest increases,
this reveals that more new longs have entered the market and more new money is
flowing into the market. This reflects why the price increases. Of course, the
exact opposite is true on a declining market. Chartists combine both the price
movement and the data from volume and open interest to evaluate the “condition”
of the market. If there is a price increase on strong volume and open interest
increases, then this is a signal that there could be a continued trend advance.
Of course, the opposite is true for a bear market when prices decline. Also, if
prices increase, volume stays relatively flat or little changed, and open interest
declines, then the market condition is weakening. This is considered to be a
bearish situation because if open interest is declining and prices are rising,
then this shows that shorts are covering by buying back their positions, rather
than new longs entering the market. That would give a trader a clue that there
is a potential trend reversal coming.
Here is a
guide as to how to use this information to identify an opportunity when there
is a major top or bottom in the spot forex markets: When observing a continued
long-term trend in a spot forex currency, if it trades as a futures contract
(whether it is in an uptrend or a downtrend), when prices start to fluctuate
with wider than normal daily price swings, or ranges, or are in an extremely
volatile condition, if it is combined with unusually strong volume and a
decline in open interest, this is referred to as a climaxing market condition.
The market is getting ready to turn or reverse the trend.
In Figure
1.36, the graph is a split chart of the futures euro currency on top with the
volume and open interest study in the middle. The spot forex euro currency is
on the bottom. Notice that after the peak in prices, the volume was increasing,
as was the open interest.
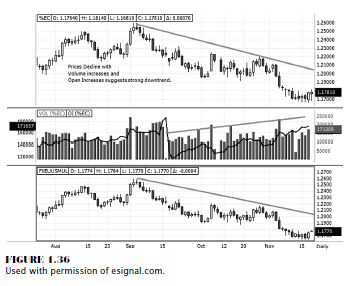
This was
a warning that a trend reversal was forming, rather than a small correction.
Therefore, spot forex traders would have a better decision-making process, that
selling rallies and looking to take sell signals at resistance would be a more
fruitful and profitable course of action.
The Candlestick and Pivot Point Trading Triggers : Chapter 1. Trading Vehicles, Stock, ETFs, Futures, and Forex : Tag: Candlestick Trading, Stock Markets, Pivot Point : benefits of being a forex trader, is forex trading good for beginners, how much do forex traders make a day - Benefits of Forex Traders from Future Markets