Seasonal Stock System
simple MACD trading, reversal of trend, candle patterns
Course: [ The Candlestick and Pivot Point Trading Triggers : Chapter 11. The Sample Analysis ]
Reveal many top-notch statistical studies based on past historic price action. Many of their strategies are based on seasonal factors that help stock pickers time the markets.
SEASONAL STOCK SYSTEM
Reveal many top-notch statistical studies based on past historic price action. Many of their
strategies are based on seasonal factors that help stock pickers time the
markets. One of the methods they promote is using a simple MACD developed by
Gerald Appel to better time entries and exits during the best six-month period
for stocks, which starts in October. Once a market bottoms out and develops in
an uptrend, the MACD indicator triggers confirmation that a price reversal is
underway. The MACD signals help traders time their entries. However, as we
uncovered in prior chapters, it is a lagging indicator. With that said, I
believe what can make that buying program or system more effective is to add
and apply a weekly and/or monthly pivot point study. This may give a trader an
edge by adding another dimensional element that combines the seasonal factor
for timing with targeting a price level from pivot points. Using this approach
can help light the path to a trading system that a trader can back-test on his
or her own through software such as Genesis.
HISTORY LESSONS
I want to
combine the lessons on how to choose the right pivot point support and
resistance numbers with how those values relate to the market direction number.
This can help you determine if the market has departed too far from the mean or
too far from what I call the “fair value” of
the market. Start by examining the past price history. Once you see where the
market was and how far the market has moved in a given length of time (pace of
price change), you can possibly determine the realm of reality of where a
target level of support may be located. You can use this information to determine
if a market is significantly overbought or, as we will show in this example,
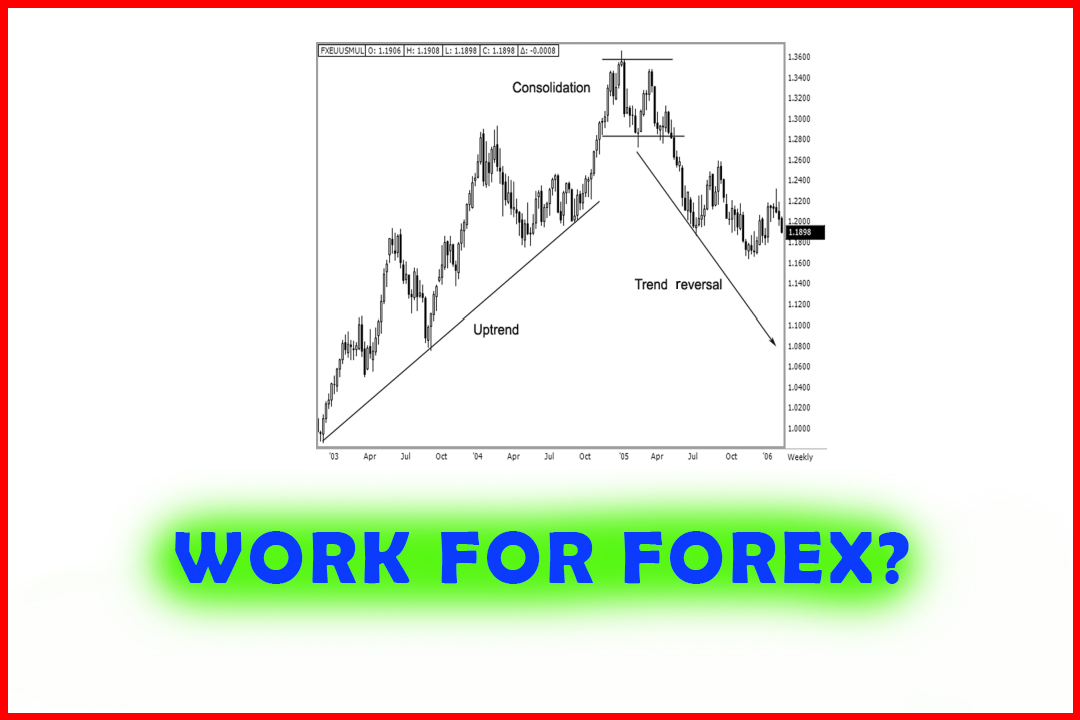
oversold and ripe for a buying opportunity. When a market is significantly
oversold, the conditions exist for a consolidation phase and a reversal of
trend, especially when we have a seasonal condition. This concept applies in
commodities, stocks, and foreign exchange (forex) markets as well.
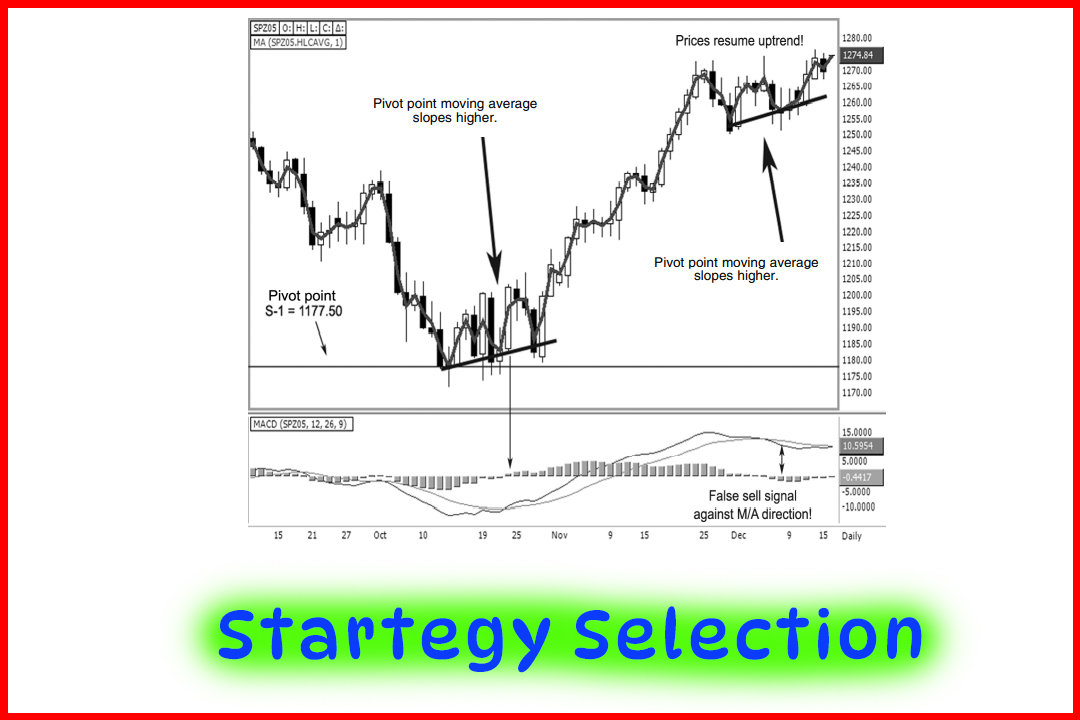
Let’s
take a look at how the bottom formed in the stock market in October 2005 as we
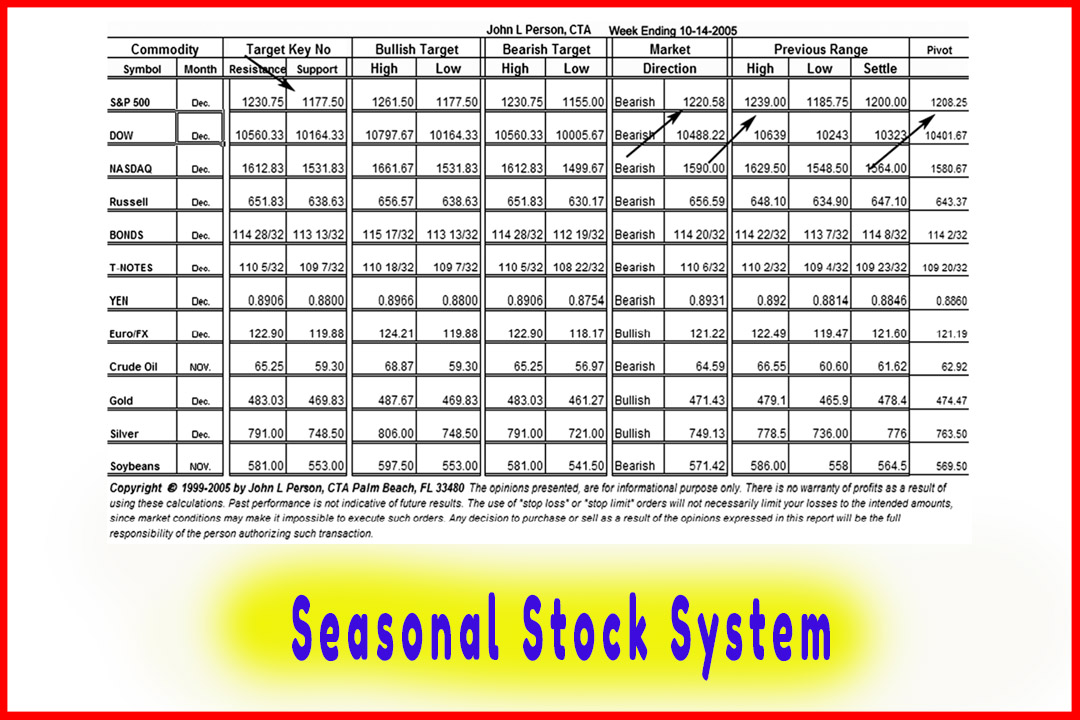
review and expand on the Stock Trader’s Almanac MACD signal. Figure 11.1 is my
sheet from the week ending October 14. We use this sheet as a quick reference
so I can see what the past week’s high, low, and close were. The pivot point is
displayed in the far right column. We see that in the prior week, the high in
Standard & Poor’s (S&P) was 1239. The pivot point is 1208, and the
pivot point moving average is 1220.58 (round down to 1220.50). The indication
is that the market is bearish, so we would look at the Bearish Target column
and see 1155. Here is where back-testing software may help you determine what
the largest price range is in a given week in the S&P on a historic basis.
Why is that relevant? Because I want to know if 1155 is an unrealistic number
to hit if the market was at 1239 and the standard range was 40 points.
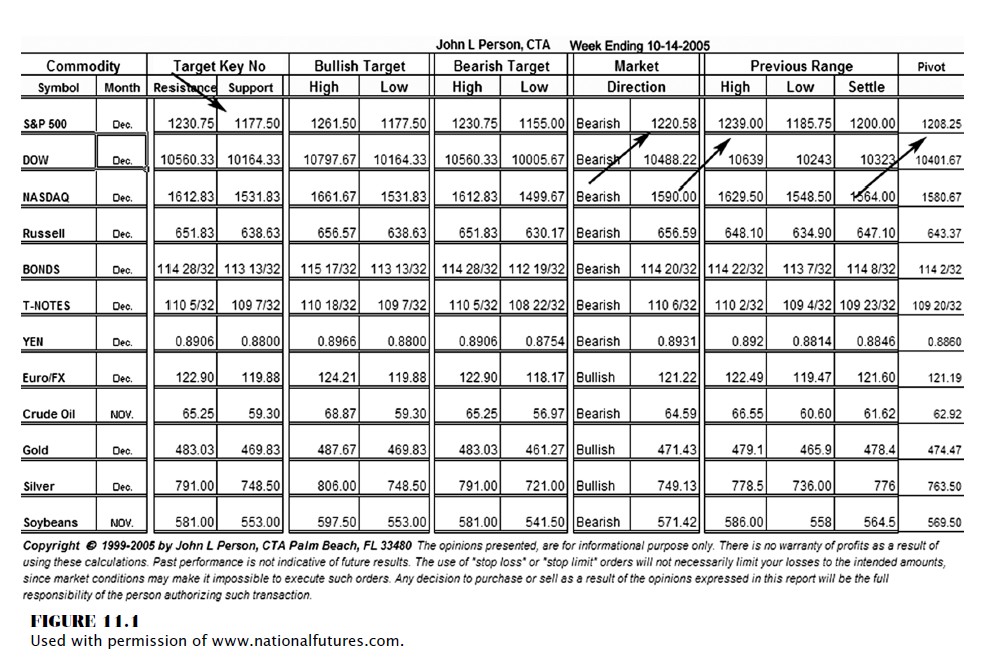
From the prior week’s high to the projected
bearish S-2 target low, that would be an 84.00-point price decline. Not unheard
of but not realistic, at least not in one week’s trading period. At the very
least, we need to see how the market reacts at the S-1 target support number,
1177.50, labelled as the Target Key Number, which is the S-1 pivot number.
On
further examination, we see the market closed the week ending 10/07/2005 at
1200. So sometime in the following week, I want to heighten my awareness or program
a system to alert me to when or if the market reaches that level and if a buy
signal exists at or near 1177.50, such as if a hammer or doji is present within
five points above or below that level. After all, we have a decent sample of
statistics that reveal that these two candle patterns form at or near the lows
in e-mini-S&Ps a high percentage of the time on an intraday 15-minute
period.
The low
was made on 10/13/2005 at 1172; it closed that day back above the pivot support
at 1178.25. The next session formed a high close doji (HCD). Using the HCD
pattern and trading by the rules, you would have bought at 1189.75; and your
risk was a stop on a close below the doji low, which was at 1172. The most
pressure you took on a futures position trade was from your entry price to the
lowest low on a pull-back was when it retested the low at 1174, which is 16
points. The stop-close-only order was the correct risk mechanism for this
position trade. Using a seasonal factor combined with pivot point analysis
helped traders pinpoint both the time and the price of a particular market; and
in using historical seasonal information, traders would possibly want to employ
a longer-term risk-and- reward strategy. Even if you are a one-day or swing
trader, seasonal factors can help identify the side of the market to be on,
like in a bullish environment to look to buy breaks. My point is that if you
are a position trader, your risks and reward objectives should be greater than
those of a day trader. Here we have a trading opportunity based on several
factors. All we need to do now is select a strategy.
The Candlestick and Pivot Point Trading Triggers : Chapter 11. The Sample Analysis : Tag: Candlestick Pattern Trading, Forex, Pivot Point : simple MACD trading, reversal of trend, candle patterns - Seasonal Stock System