Work for Forex?
How to trade forex, Time to trade, Volatility
Course: [ The Candlestick and Pivot Point Trading Triggers : Chapter 11. The Sample Analysis ]
Since currency trading is a large component of my trading, I wanted to optimize a system for forex. The Defcon model was tested to stand up against a non-correlated investment vehicle to the equity markets.
DOES THIS WORK FOR FOREX?
Since
currency trading is a large component of my trading, I wanted to optimize a
system for forex. The Defcon model was tested to stand up against a non-correlated
investment vehicle to the equity markets. I chose the euro currency market to
run a performance test. As we discussed in Chapter 7, due to the computers’
inability to test the forex markets’ data because there is no centralized
market and prices are quoted in bid/ask form, we ran the test using the euro
currency futures, which trades parallel to forex markets. The test period was
conducted using 15-minute intervals during the U.S. open outcry trading session
from 8:20 a.m. (ET) until 3 p.m. (ET).
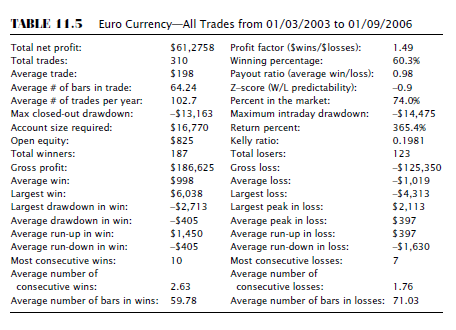
The
winning percentages were not as great as in the S&P; but, boy, the
bottom-line results showed a healthier profit! Table 11.5 shows the rate of
return with 365 percent, but it was based off a recommended starting balance of
$16,770. The overall gross profit was $61,275, based on a test period that went
back three years. We had 310 trades—the system generated slightly more trades
here than in the S&P. This may indicate that the market is more volatile,
not less, as some people believe
As for
the test period, I believe this was a good time frame because it represents a
great sampling of various market conditions, considering that we had several
market conditions exist: bull trend, to a consolidation phase, and then a trend
reversal or downtrend.
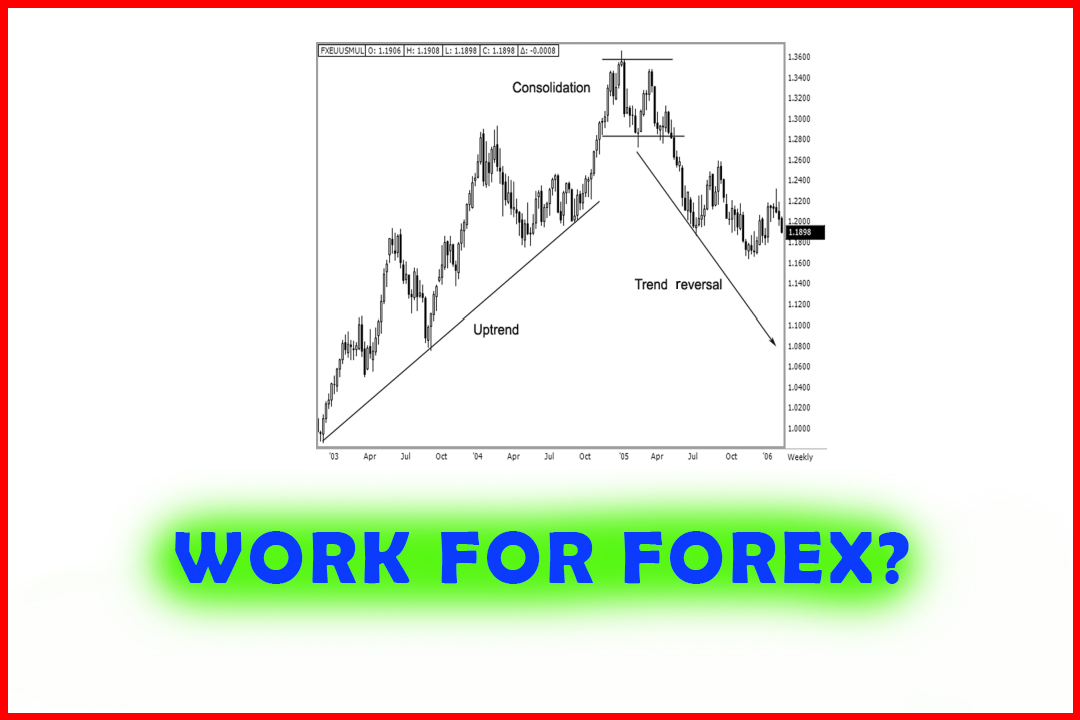
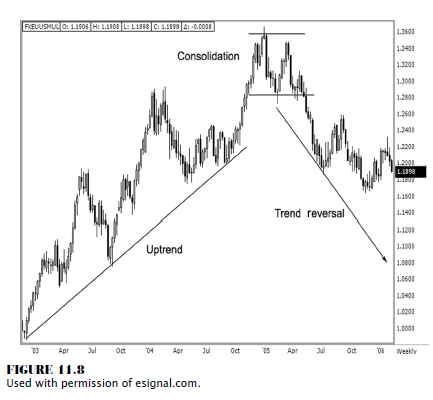
In
January 2003, the euro was valued at 1.0500 to the U.S. dollar. It went as high
as 1.3660 in December 2004; and as of February 2006, the euro was back at
119.00. During that time, the market conditions changed from bullish to bearish
and went into a consolidation phase as well. We want to see how a trading
system performs in various market conditions. Notice the three market
conditions as indicated by the trend lines drawn in the weekly euro currency
chart in Figure 11.8. According to the test results, the system fared pretty
well.
Let’s
examine both the volatility and the margin requirements. As of February 15,
2006, the daily initial margin requirement to trade one euro currency with a
125,000 contract value (margin requirements are set by the exchanges and are
subject to change without notice) was $2,835.00. As you can see, we are trading
a highly leveraged market that has an average daily range of approximately 86
PIPs (percentage in points) per day. In the futures, each PIP is $12.50.
That
computes to a daily trading range of $1,075 per day. In using strict money
management guidelines, we are using only 28 percent of our investment capital.
So in the spirit of being a great trader, I want to ask why I would trade only
one contract with a starting account of $10,000. The answer is clear, and
another great example of why it is important to know what you are doing before
you do it. By back-testing a system, I can determine what the worst to expect
is. Granted, we did not implement any means for risk management. The Defcon
system solely generates a trade triggered by the pivot point moving average
approach. You will see that by going back and validating the methodology, we
had a single loss in the amount of $4,313. That is the bad news; and more than
likely, as with any severe and sudden market loss, it was generated by a shocking
news event. The monthly unemployment report on August 6, 2004, was one such
event where the euro currency moved almost 260 points in a single day. This was
a good definition of a news-driven price shock. As the data in Table 11.3
shows, the profits were bigger in the euro than they were in the
e-mini-S&P; but so were the risks. So we have a bigger profit; but along
with that greater profit came greater risks. How many times have you heard that
before? The bigger the risk, the bigger the rewards. I have heard that a bunch
of times, but it is great to see it put in front of me based on a defined set
of rules. So if I get the feeling one day to go “all in” like a poker player
and use 100 percent of my margin, in the euro currency I could easily do three
contracts. In one bad day, not only would I wipe my account, but I could be
deficit, meaning I could actually lose every penny in my account and owe money.
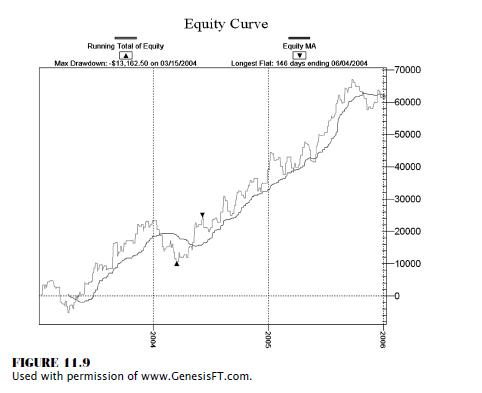
Using the
back-tested results of a system allows me to see my pro-gram’s strengths and
weaknesses. That is the edge I have against the market—knowing when to raise my
positions and when not to. Besides learning that my system can make money, I
also found out that I need to double my account if I want to double my
positions. Using a computer product like Genesis allows me to identify and
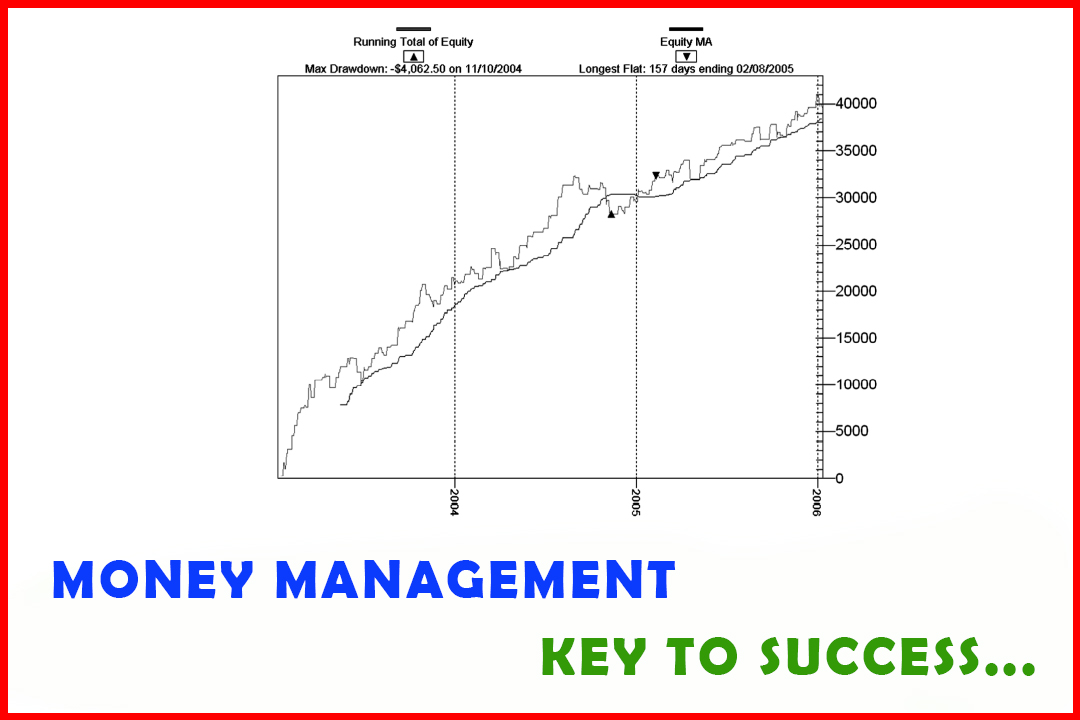
validate the methods employed. As we look at the equity curve in Figure 11.9,
we can see a solid performance; and that should help maintain your confidence
to stick with trades generated by the signals. Figure 11.9 also highlights a
negative $13,162.50 maximum drawdown from peak profits. Imagine increasing your
lot or contract size prematurely during that negative phase. It would certainly
ruin your trading day, year, or even career!
In the
stacked bar graph in Figure 11.10, we see the results of peak performance; and
more important, we see the kink in our armor, the weakest point in our system
from a seasonal perspective. By back-testing the system, our diagnosis shows a
seasonal weakness in the markets that occurs in January and February and
continues into March. We know from the table in Figure 11.1 that we have a
string of winners that last on average 10 in a row.
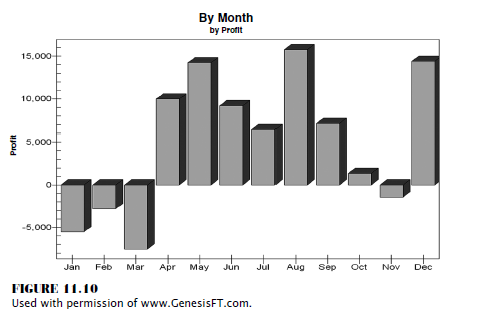
Therefore,
if at the end of October I have 10 winners in a row, I think I will be more
selective in my trade signals in November! As you can see, the statistics show
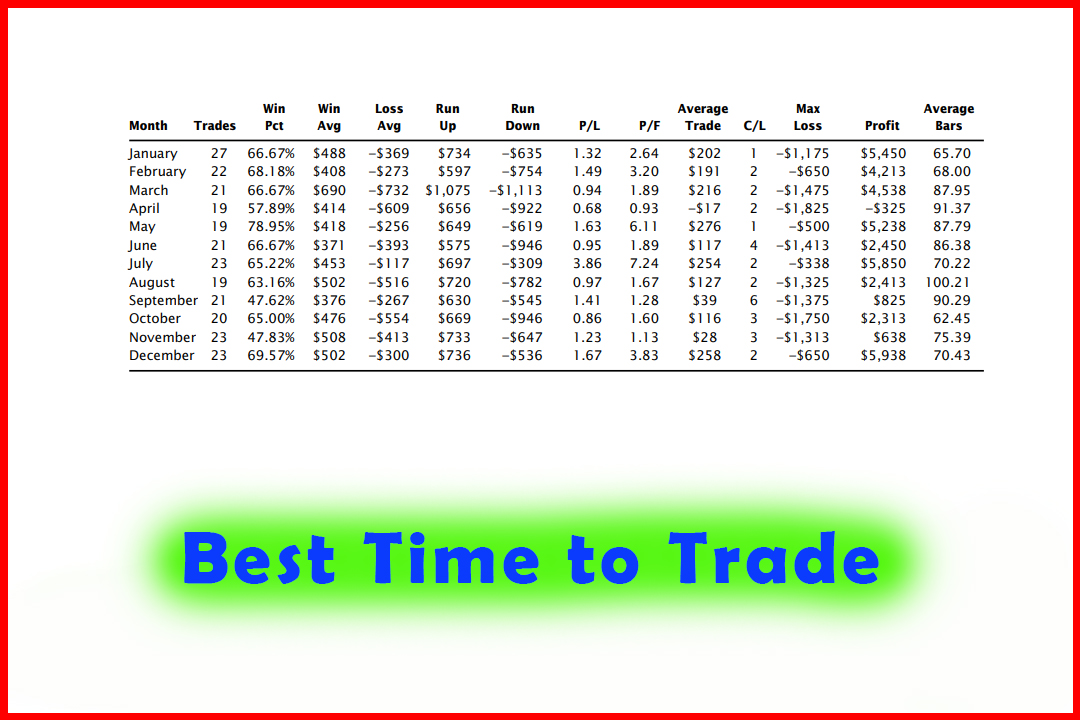
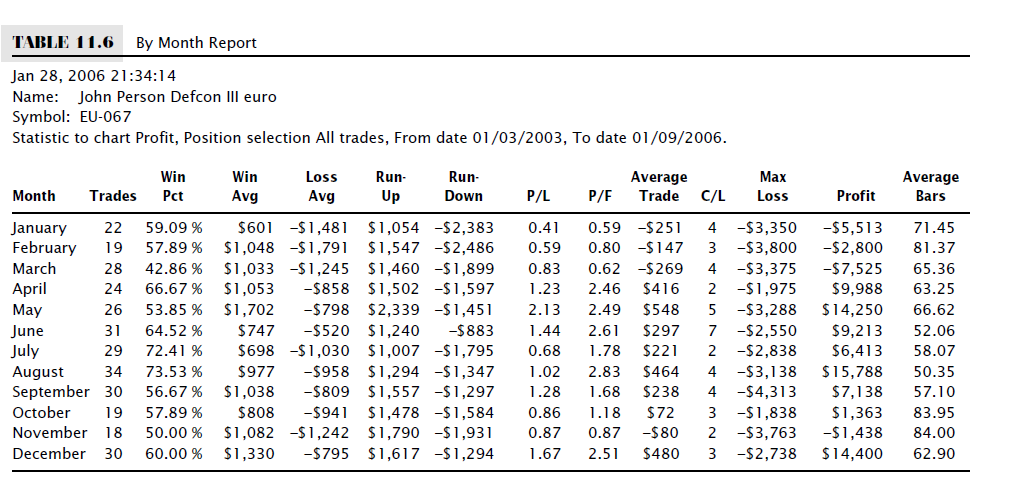
small drawdowns in November. According to the three- year test period, April
through August is the most profitable trading time period (Table 11.6). We can
enhance our performance by not trading in April, though, as that was one of the
worst-performing months as indicated in Figure 11.6 on page 297.
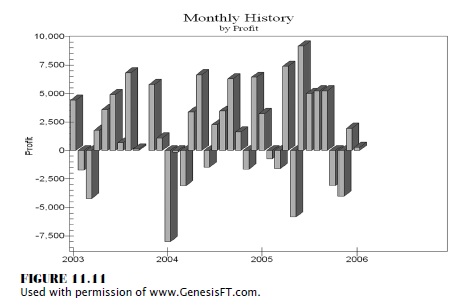
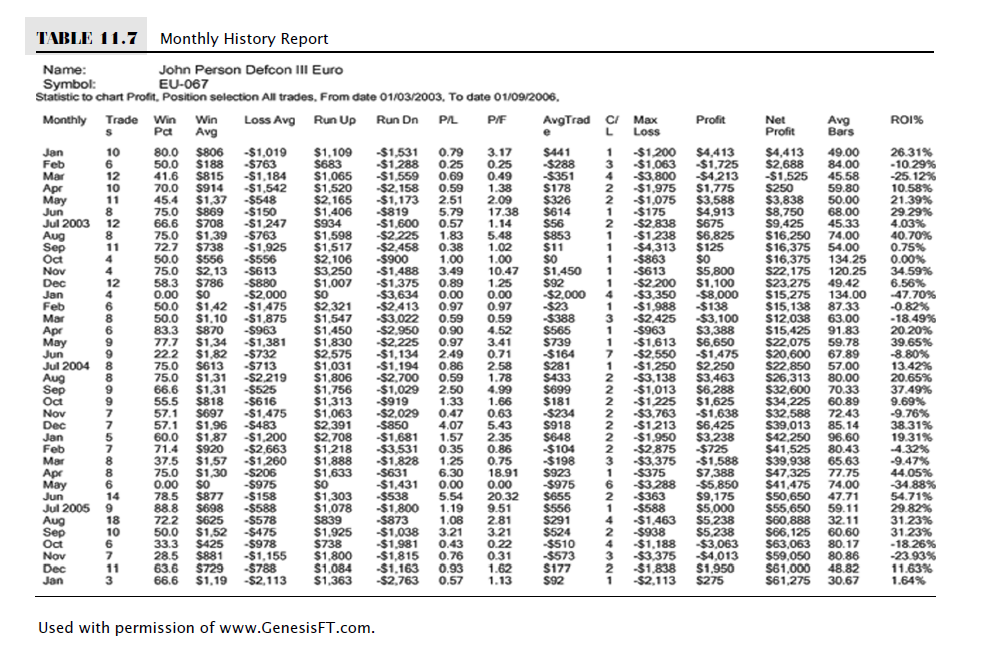
As you
break down the numbers by the statistical results, it is by that data that you
can determine the validity of your methods (Figures 11.11 and Table 11.7). When
we look at a month-to-month breakdown of the euro currency, we see January 2004
was a whale of a disaster, as shown in Figure 11.11! With this information, we
can determine if the cause of the disaster was the system, the methods, or one
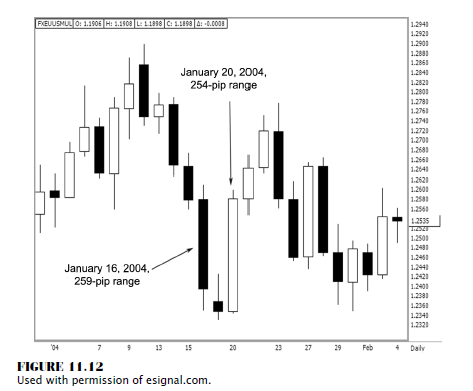
heck of a wild trading period. The answer should not surprise you: It was the
last. There were only two days that had daily trading ranges over 250 points.
On January 16, 2004, the market dropped like a hot sack of potatoes, with a
high of 1.2610 and a low of 1.2351, for a range of 259 points. Then two days
later, it reversed higher, with a low of 1.2345 and a high of 1.2599, for a
254-point range. The market gained back what it lost; but overall, it was simply
a very violent trading period, as Figure 11.12 shows. Without some type of
intraday risk management method, such as a trailing stop, all traders at some
point will be subjected to news-driven price-shock market environments.
No one is
immune to them. The good news is that they do not occur frequently, as this
data shows.
To
summarize, the essence of back-testing is validating your methods and showing
the strengths and the weaknesses of your system. Moreover, it will help you
define your goals and expectations for performance. Therefore, it can help you
achieve the highest trading profits with the lowest risks in most trading
market conditions. I want to elaborate that by studying a system, in all market
conditions, you at least will be better prepared and less shocked when an
eventual negative situation develops in your trading career. The main goal in
trading is consistency and staying in the game. Statistics show this!.
The Candlestick and Pivot Point Trading Triggers : Chapter 11. The Sample Analysis : Tag: Candlestick Pattern Trading, Forex, Pivot Point : How to trade forex, Time to trade, Volatility - Work for Forex?