Strategy Selection in Stock Market
Best Trading Strategy, MACD trading strategy, Pivot Point, Moving average
Course: [ The Candlestick and Pivot Point Trading Triggers : Chapter 11. The Sample Analysis ]
If buying the futures markets seemed too risky, you at least have a situation where you can explore longer-term low-risk/high-reward options strategies such as S&P call options.
WHICH STRATEGY TO SELECT?
If buying
the futures markets seemed too risky, you at least have a situation where you
can explore longer-term low-risk/high-reward options strategies such as S&P
call options. That was my recommendation in my weekly newsletter. You could
apply this analysis to buy Standard & Poor’s Depositary Receipts (SPDRs),
Diamonds, Nasdaq QQQs, or options on those
exchange traded funds. That is one reason why I spent time going over
those products in Chapter 1. Seriously, if you are just a day trader in futures
or forex or simply a stock trader, diversification is a trader’s best friend.
Anyone who is after profits and making money can apply these techniques. To any
investment vehicle, a trading system can be programmed to alert you when dojis
form near pivots support or resistance levels. Moving average crossover
features using various parameter settings can also be applied. This form of
market analysis is adaptable and very versatile for integrating in a trading
system.
WHAT ABOUT THE MACD?
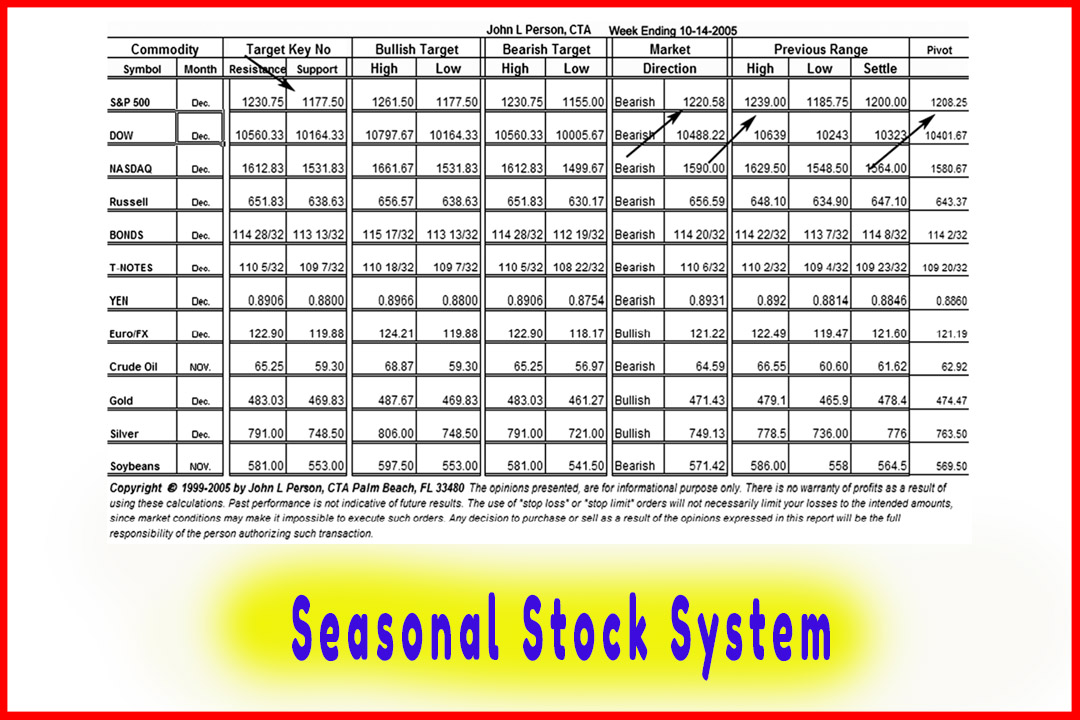
Pivot
point analysis enhances what Stock Trader’s Almanac reveals. Looking at the
chart again in Figure 11.2, you see how the MACD indicator gave a buy signal
triggered by the zero-line crossover and a moving average crossover on October
24. This was generated on the close at 1202.25.
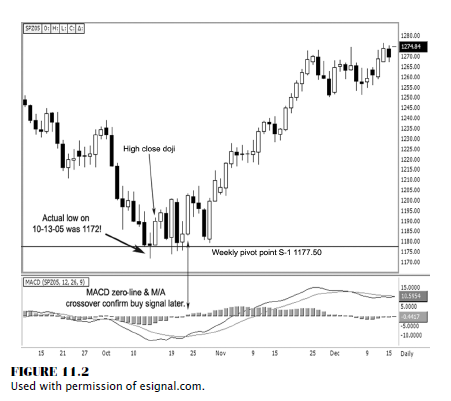
Not knowing
the risk you want to take with the MACD seasonal buy signal, if you bought at
that price at that time, the most pressure you took on the trade was 22 points,
slightly more than the high close doji trigger signal. Also the MACD signal
came a bit later. This is why all traders can use pivot point support and
resistance analysis to help time trades better with both elements, time and
price.
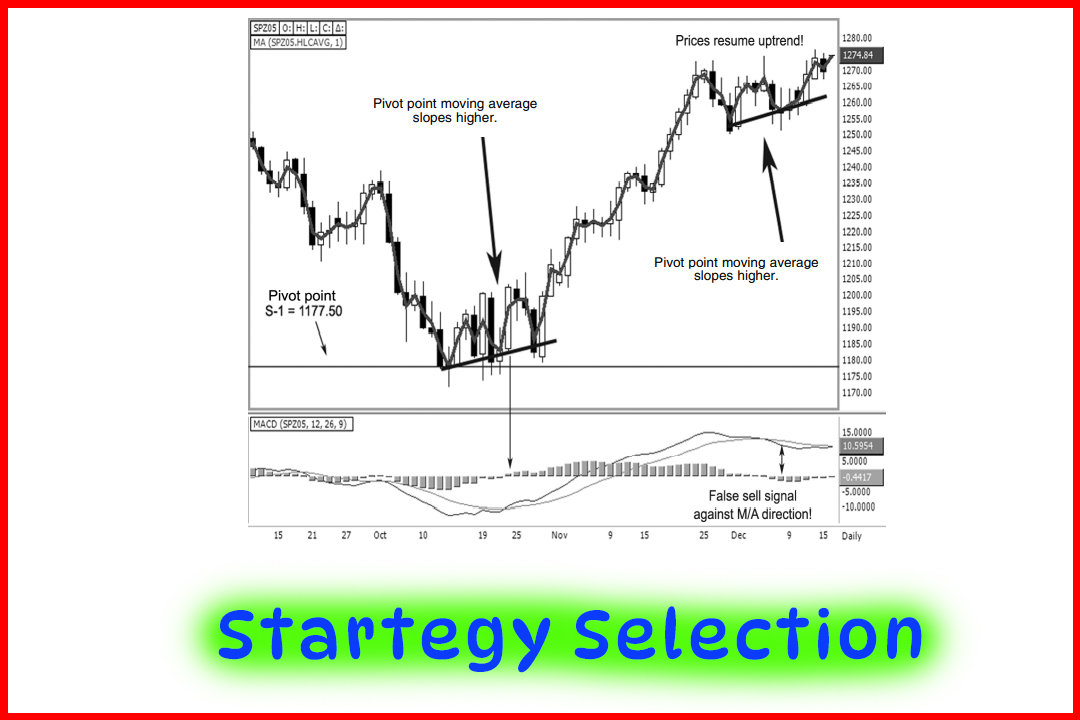
I went
over how to use the pivot point as a moving average in Chapter 6. In Figure
11.3, I took the liberty of highlighting the pivot point to illustrate the
slope (or direction) of the moving average. Once the market hits the pivot
support, the market moves in a consolidation phase; but the pivot point average
is sloping higher, indicating a bullish bias. Granted, you always want to see
immediate results as a trader; but using the seasonal factors identified by
Stock Trader’s Almanac combined with pivot point support targets and a pivot
point moving average component gives you a much better timed entry and method
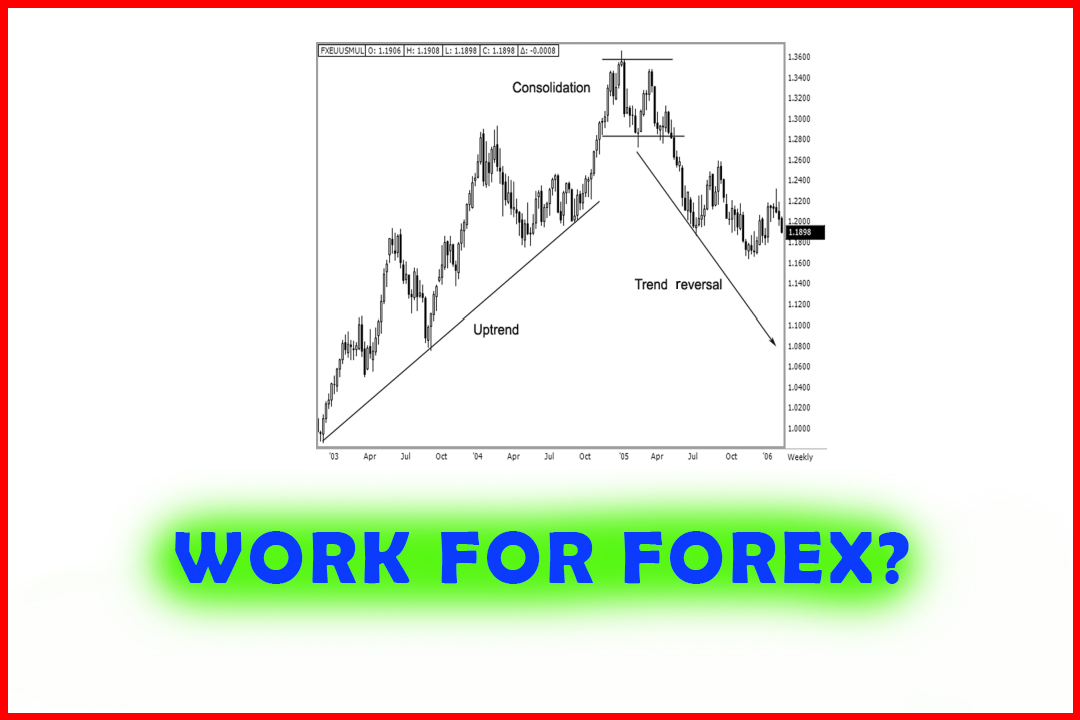
to identify a trend reversal.
One more
advantage of incorporating the pivot point average is that as the market
finally blasts off, the moving average component generates a sell signal and
the histogram makes a negative zero-line cross.
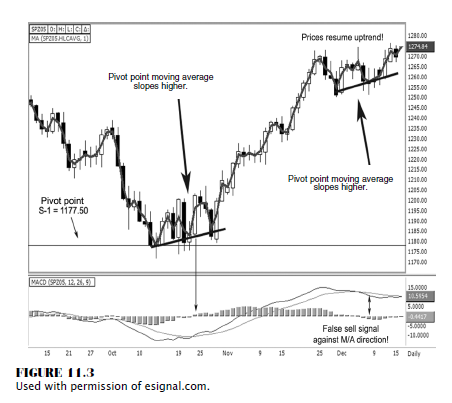
However, that
is the opposite of what prices are showing from the candle patterns, as we do
not see a succession of lower closing lows. In addition, the pivot point moving
average is sloping higher, once again indicating a bullish bias. From a systems
programmer looking for a defined set of rules, when you develop your own
system, it is important to make sure that your set of criteria or the series of
conditions that exist all need to be in sync, such as all must be generating
sell signals, before making your entry or exit triggers.
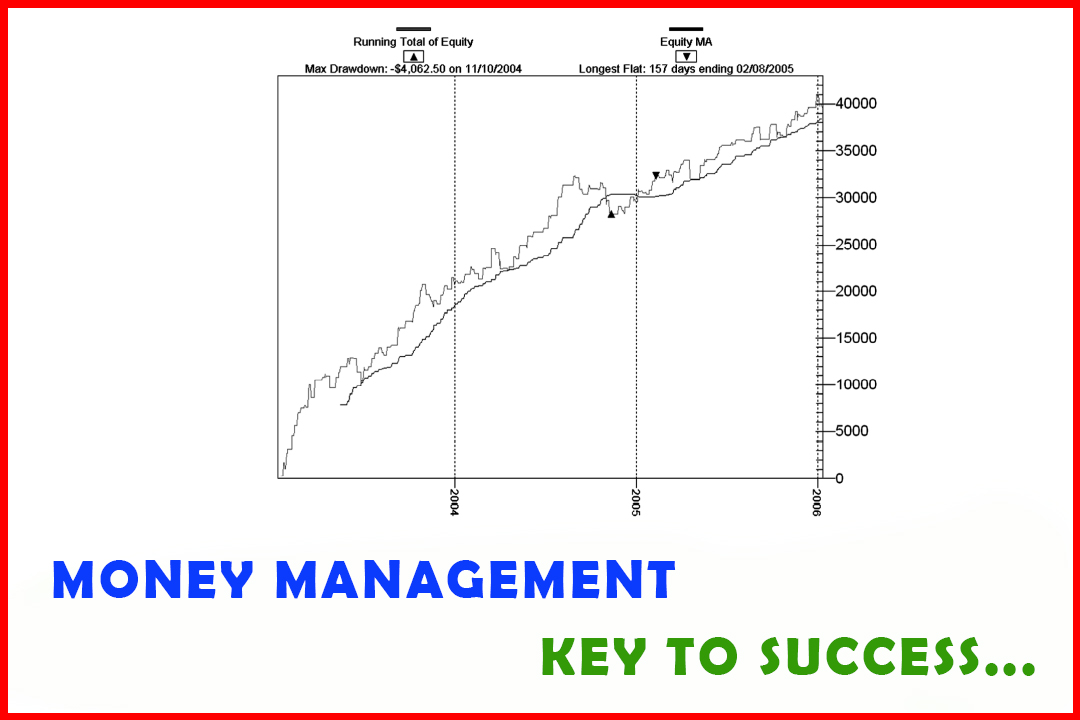
In Figure
11.4, the Genesis Software has my algorithms programmed with variations of what
was covered in this book to show you how you can develop your own personal
“black box” system. As this illustrates, for my day trading program, I use both
the 5-minute and the 15-minute periods with the e-mini-S&P, the Chicago
Board of Trade (CBOT) mini-Dow, 30-year Treasury bonds, euro currency, and the
spot forex British pound. Except for in this figure, the one chart that is
second from the right is a 5-minute chart on bonds; and under it is a 15-minute
chart on the euro currency.
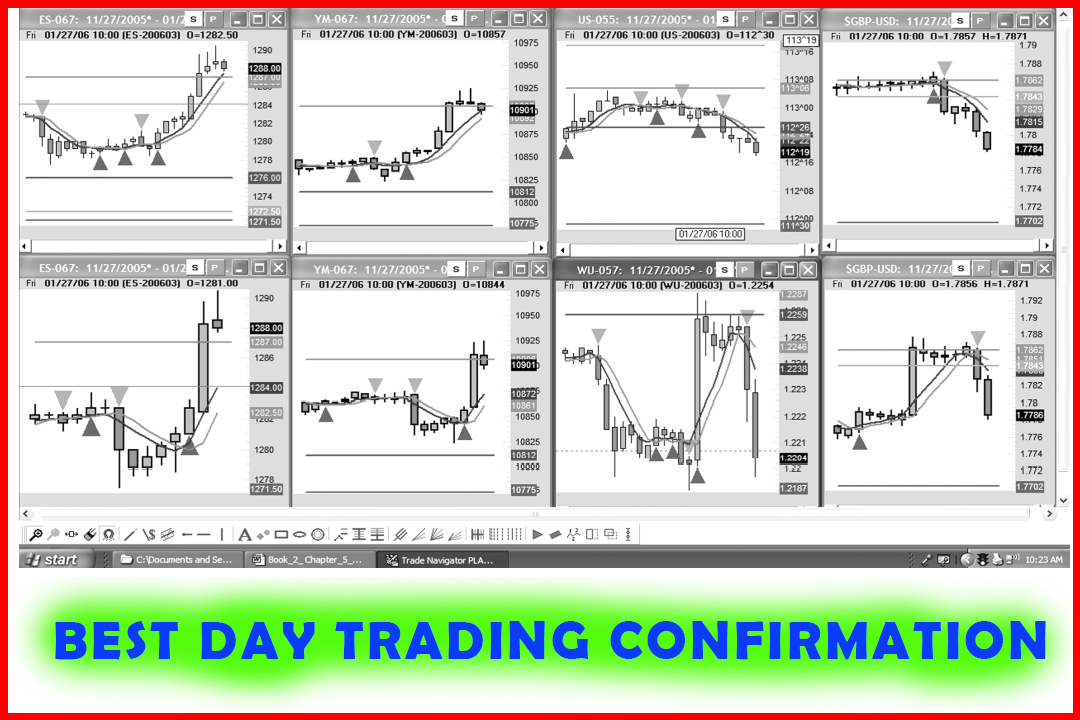
I use
this system to help confirm buy and sell signals, as indicated with the arrows.
When we are at the projected support targets, which the software indicates by
green support lines, arrows appear, indicating to go long. The chart on the
left is the e-mini-S&P; the 5-minute is on top and the 15- minute is
beneath it. See how arrows point up simultaneously, which indicates a buy
signal, especially as the market is near support. The chart second from the
left is the mini-Dow with the 5-minute on top and the 15- minute beneath it.
The 5-minute time period generates a buy signal against the pivot point support
targets simultaneously with the e-mini-S&P. This corroborates the buy
signal, as it has developed in both markets. It is also confirmed in the
15-minute chart beneath it.
The Candlestick and Pivot Point Trading Triggers : Chapter 11. The Sample Analysis : Tag: Candlestick Pattern Trading, Forex, Pivot Point : Best Trading Strategy, MACD trading strategy, Pivot Point, Moving average - Strategy Selection in Stock Market