Advanced Fibonacci Trading Techniques
Internal Retracements, External retracements, Fibo Expansions, Fibonacci Retracements, Projections
Course: [ Advanced Fibonacci Trading Concept : Fibonacci Trading Strategy ]
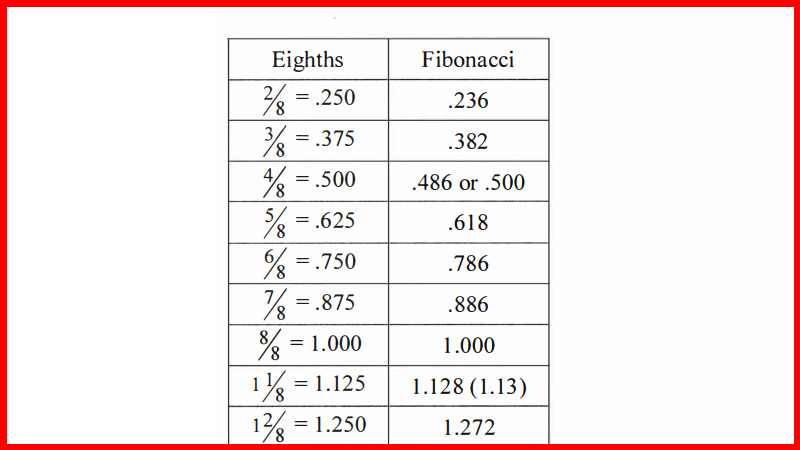
Traders have to individually make this decision, with regard to confirmation, as far as how much they feel they need. For me, it’s an almost linear decision. I need almost no confirmation for a .236 grouping, a small amount for my usual .382-.447 grouping on a smooth, strong trend, and more and more as the groupings are based on larger retracements.
Fibonacci Trading Techniques
Now that we have the idea of how to create
some nice groupings, how can we look at those from a trading standpoint? To
begin with, we first decide on a timeframe and on a trend, we would consider
trading. This trend will always be larger, by definition, than the pullback or
correction we are trying to enter the trend on.
In the previous chapter, I made it pretty
clear that I personally prefer to look for trends and then construct groupings
in the approximate zone between a .382 and .447 pullback of the entire traded
trend up to that point. Does this mean that I won’t take a trade with a
grouping constructed around a .236 retracement? Or the larger .618 or .786
retracements? Absolutely not.
There are plenty of great trading
opportunities around the shallower .236 retracement zone. And, in fact, I find
more information out there about trading around the .618 retracement area than
any other area. Likewise, there are also specific patterns that terminate right
on the .786 retracements, as well as the .886 retracement. Groupings based on
these areas can set up some very nice trades.
I just want to point out that I, myself, like
the well-established trend with a moderately shallow (.382-.447) pullback. I
feel that if the correction is greater than this .382-.447 amount, you have a
pretty good countertrend move in place. This makes me feel like the momentum is
now beginning to pick up in the direction opposite of the direction of the
trend I want to get on board. Consequently, if I ‘feel’ momentum building in
the opposite direction, I don’t feel as comfortable getting on board the
original trend.
Don’t get me wrong, the momentum of this
countertrend can quickly reverse and the original trend re-establishes itself.
Many trading styles are even based on this type of reversal play. In this
chapter I will include some examples based on the areas outside of my preferred
.382-.447 area, because some readers may prefer to trade in these zones. Keep
in mind, you need to find areas that you are comfortable with for your trades.
I like the fairly smooth trend with .382-.447
pullback for what seems, to me, to be logical reasons. I find the .236 area too
shallow, and many times the correction will continue after a consolidation or
small countermove. This continuation will shake me out, since I usually keep my
stop just below the grouping I’m using for the trade.
The downside to my shying away from the .236
area is that in a very strong trend, that may be all the correction you get.
Moreover, if you do get in on that small pullback, you can have quite a move
ahead of you, which could be profitable enough that if you miss it, you might
be tempted to really kick yourself. This is where I use my judgment to make a
decision. Again, this is my own thinking process here. You need to develop your
own processes, based on your own game plan and risk/reward scenario.
If the trend is very strong and smooth (I
determine if it is strong and smooth by comparing it to how that issue usually
behaves), I may set up a grouping around the .236. If I like the behavior on
the smaller time frame and get a clean trigger, I will consider the trade. I’ll
be on the lookout for the correction to continue and stop me out. If so, I’ll
stay with my stop and look to re-enter on the .382 -.447 groupings.
If you like this .236 setup and have a higher
risk tolerance, you can look to enter in the .236 area and put a stop just
under the .382-.447 zone. The nice thing with the .236 area is that if that’s
all the pullback you are going to get, the trend is usually pretty strong and
the reward may be significant. That may justify having a wider stop. If I don’t
have a trend that is very strong and smooth, I will just construct my groupings
between the .3 82 and the .447 retracements, and skip the .236 area.
Constructing groupings in the larger retracement areas (such as the .618, .786 and .886) follows the same procedure as shown for groupings in the .382-.447 area. The major difference for me in my trading those groupings is how much confirmation I generally want, to convince me to take the trade. The more the counter trend move has travelled, the more nervous I get that it may be a new trend. The more nervous I get, the greater the premium I’m willing to pay in terms of confirmation.
Traders have to individually make this
decision, with regard to confirmation, as far as how much they feel they need.
For me, it’s an almost linear decision. I need almost no confirmation for a
.236 grouping, a small amount for my usual .382-.447 grouping on a smooth,
strong trend, and more and more as the groupings are based on larger
retracements. For an .886 grouping I would need a lot of confirmation on the
smaller time frame.
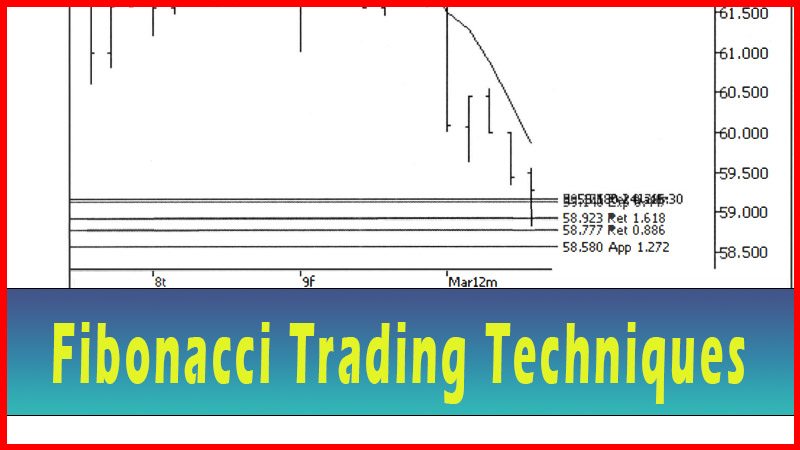
Let’s start with a look at a trend with a
fairly deep correction. See figure 10.1.

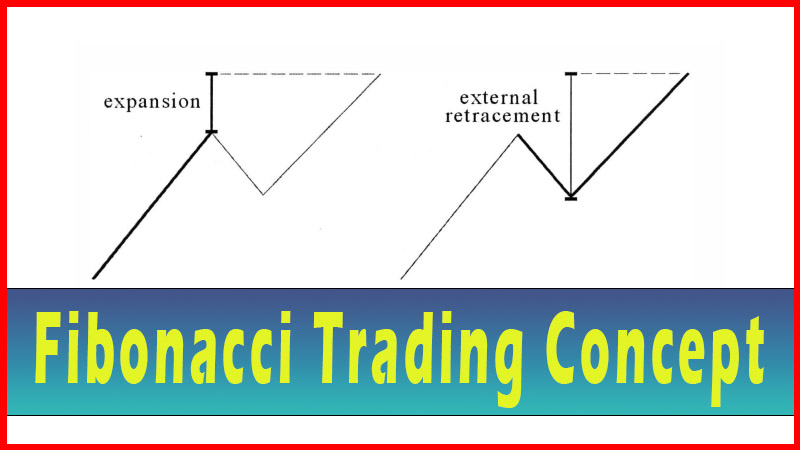
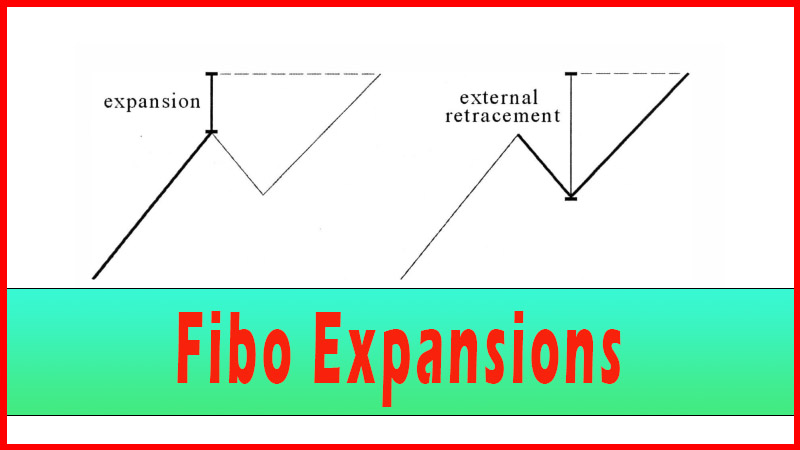
We have a nice tight grouping where we feel a
trade might be taken. The grouping has internal and external retracements, a
projection and an expansion. The assumption is the trend may resume in this
area. We have a few choices now. One choice would be to take the trade once it
simply gets to the zone. This has the look of catching a falling knife, but that
would still fit the risk profile of some traders. Since the trade is in the
direction of the larger degree trend, it’s not as outrageous as it might seem.
Again, this type of decision is up to the individual trader’s risk profile.
You can also watch as the price action enters the grouping and wait for it to stall, hoping to avoid a falling knife (by waiting to see if it has at least stopped falling). This would seem to have a little bit less risk than the first option. Again, this is a personal decision based on the risk parameters you’ve decided on for your trading.
Next, you could wait for the price to start to
tumble in the direction of the trend. This would likely have even less risk,
but sometimes a bounce can happen quite fast and you may get left behind. The
more confirmation you look for, the more of the move you may miss.
If your risk profile demands a lot of
confirmation, you can give up some of the potential move and look for a trigger
that the move back in the direction of the trend has fairly started. Is that
any guarantee the move will continue? Of course not, that’s what stop losses
are for.
There are an almost infinite number of
possible triggers to use, once the price action has reached the target zone.
Some examples might be: price crossing a moving average, dual moving average
crossover, Bollinger band reversal, trendline break, exceeding the high or low
of the previous bar, taking out a swing-high or low on a smaller time frame,
simply entering the zone, and so on.
The issue here is to determine how much
confirmation, if any, you want before you decide to take the trade. Although I
have been strongly emphasizing this decision is up to the individual trader’s
risk profile, there are some thoughts to consider in making this decision, as I
started to discuss in the beginning of this chapter. It would seem that the
longer the correction or pullback is, i.e., the longer the counter trend has
become, the more confirmation you would want.
Why would that be so? You never know when a
countertrend move is the start of a new trend and not a countertrend after all.
Since we are going on the assumption that a trend in motion tends to stay in
motion, the longer the counter trend move goes, the more it would seem to be a
new trend, and not a correction. This leads me to want more confirmation the
deeper the correction has gone.
As mentioned, this may translate to little or
no confirmation for shallow pullbacks in the .236 or .382-.447 retracement
areas. Much greater confirmation would be required in the .618 or .786
retracement areas, such as requiring a smaller time frame swing-high or low to
be taken out. It was not my intention to present various trigger styles in this
work. I want to leave that up to the individual traders so that they can use
what they already know and are comfortable with, with the new concepts I’ve
presented here.
Let’s move on to an extensive series of
examples, with notes on possible triggers. Since the real world has many failed
trades, I will choose some examples with groupings that fail to hold. One of
the things that you may see is that if a price grouping fails to hold, the
price action frequently gravitates to the next grouping like a magnet.
This can be helpful in determining where to
put your stop loss. One choice, the one I use most commonly, is to put the stop
loss just below the grouping you are using to enter the trade. Another choice
is to place the stop loss just below the next grouping. You would want to
consider how far away that next grouping is, to determine if it is feasible for
use as a stop loss area. If it’s not too far away from your risk profile,
you’ll be stopped out of less trades using it, but you'll lose more when you
are stopped out. This is, perhaps, another of the great dilemmas of trading. In
very noisy markets the farther stop may be necessary.
Let’s start with what happened with the
example from figure 10.1. Here it is as it enters the grouping and a trade is
considered. See figure 10.2.

This trade has a beautiful pattern. There is
an extended abc pattern down into a nice, tight Fibonacci grouping. One
thing jumps right out at me and that is the long, down bar closing on its low
for the day, right as FRX trades into the grouping. Normally, this would be a
big alert that this issue is very weak and likely to continue down.
Why do I say ‘normally’? Many, many times you
see exhaustion moves into the groupings in the .786 and especially .886 areas.
These moves can look downright scary, only to have the issue reverse on a dime
and start a strong new trend in the opposite direction. But, in no way am I
implying that you should simply catch a ‘falling piano’ that looks to be
accelerating.
What I am saying is that, when you see this,
dial down to the smaller time frame and observe, and see what appears to be
developing. Sometimes the issue just ‘blows out the zone’, but sometimes it
respects the zone and sets up a truly great trade. If you pass every trade that
looks like the above, you may miss some nice opportunities.
Now, I can hear a few readers saying, ‘Well,
I’ve just been set up for another well-chosen example that looks as if it will
crash right through the grouping.
But I bet it’s going to reverse sharply and be
another big winner. Let’s look at a few 60-min’s chart and see if there is
anything to trigger us into a trade. First See figure 10.3.

Here is an expanded view of the grouping on a
60-minute chart, as FRX trends down into the zone. We can see that the
60-minute bar goes into the center of the grouping and reverses, closing in the
top half of the bar. Although this may be considered a reversal bar, the close
is below the open of the bar. This bar may be implying that a reversal is
starting, but I sure wouldn’t take a trade right now. Also note, we have three
bars in a row with lower lows and lower highs for the bars. This is not really
bullish.
To me, taking a trade here would be akin to
catching a falling grand piano loaded with concrete. Taking into account that
this is a .786/.886 grouping and that I prefer a pretty large amount of
confirmation as it is for .786/.886 groupings, I’d choose to wait and see what
happens. If the high of this last bar gets taken out, though, I would really
start to watch closely. Let’s move forward in time. See figure 10.4.

The next bar is an inside bar with a close in
the bottom half of the bar, and the close below the open. I’m still watching.
Let’s continue forward in time. See figure 10.5.

The low of our bar of interest is taken out,
and this latest bar closes on its low. We are getting closer to the bottom of
the grouping. I would be very careful at this point. Let’s move ahead on the
chart. See figure 10.6.

Ouch! No trade here. If you took this trade
with little or no confirmation you would have been stopped out. To my way of
looking at it, this one was never even close to triggering. To make my point,
let’s look at the chart in figure 10.3, with a very fast 5-period simple moving
average added. Some traders use a 5-period simple moving average to trigger
entry into a trade. I find this average to be fairly useful for trades where I
require very little confirmation.
This is a very quick average, prone to massive
whipsaws. It has its place when used in combination with other techniques, but
alone it will chop you to whipsaw pieces. Let’s look at the chart through the
eyes of a trader who likes to use the 5-period simple moving average to trigger
trades once they hit a grouping. Assume this trader considers his or her
trigger to be a close above the moving average. Did this trade trigger? Was it
even close? See figures 10.7 and 10.8.


As you can plainly see, this one wasn’t even
in the ballpark for triggering. I’m going through this example in such detail
because I want to show the reader the type of thinking that may go on as a
trade opportunity develops. I look at the bar characteristics, at some moving
averages or Bollinger bands, and at whatever I think would work well with the
particular issue. I then wait patiently for my trigger to actually trigger. If
it doesn’t, I just don’t take the trade. I don’t jump the gun on my trigger.
This, alone, saves me from quite a few failed trades. Sure, some successful
trades are missed because the issue just hits the grouping and then rockets
away. I’d still rather miss some and stay with my game plan, which requires a
clear trigger. Let’s see where FRX went from here. See figure 10.9.

This was a clear blowout of the zone. There
wasn’t even so much as a small move back above the zone once it was penetrated.
No trigger, no trade. They don’t all work out. That’s trading, and that’s why
you never, ever trade without a stop in place. Let’s look at another example. See
figure 10.10.

This is a great example of a large retracement
back to the .786 area. There are two groupings visible. (Note: the first
grouping includes a pretty distinct previous swing-low, which was visited on
three different days in late October and early November before DISH finally
decided to reverse there.) This example also has that ‘rapid drop into the
zone’ look, the same look as the last example. And that last example failed
miserably in the zone. There are two expansion bars in a row with closes on the
low ends of the bars.
Will the zone hold? Will the trade trigger?
For me, I’d need a pretty strong trigger to consider this trade. Two choices
for triggers come to mind. I can use the cross of a 5-period moving average
through a 15-period moving average. This would, of course, require the price to
be above both averages. The latter condition regarding price may seem like it
goes without saying, but sometimes an issue can reverse quickly and actually
drop below both the averages before they even noticeably change.
My next, and preferred, choice of a trigger
would be if the issue meets the 515 moving average cross conditions, then pulls
back, and then takes out the swing-high that it just formed. This is a lot of
confirmation and carries quite a bit of downside, both literally and
figuratively. As far as literally, it would require a wide stop, since most
logical stop placements (such as just below the swing-low) are going to be
quite far away. As far as figuratively, the downside is that you may not get a
pullback; the pullback may come quite a way after the move starts, and
consequently you would miss a lot of the early part of the move, and so on. You
pay a price for this much confirmation. Let’s see how this potential trade
develops. See figure 10.11.

This is starting to look a real lot like the
last FRX example. Now we have three down bars with low closes as we slightly
penetrate the bottom of the first grouping. Let’s dial down to a 60-minute
chart and see what is happening. The groupings are at approximately
$22.50-$22.20 and below that $21.95-$21.70. I will leave the groupings off the
60-minute chart so we can focus directly on our triggers, and add the 5 and
15-period simple moving averages, necessary for our triggers, to the chart. See
figure 10.12.

DISH has entered the first grouping and has
started to reverse. The last bar has a higher close than open, but it’s not a
really strong bar. All this matters very little since we have a clearly defined
trigger, but I like to make an assessment of the situation as it unfolds and
reserve the right to not take the trade, even if the trigger is hit. If the
action is what I would call poor (choppy, poor bar-formations, lower volume
than expected, etc.), I will not force myself to take the trade. That’s just my
personal trading style. Let’s follow this one as it unfolds. See figure
10.13.

Nope, it’s reversing right back down. At this
point I’d just keep watching as it develops. See figure 10.14.

Remember, the lower end of the first grouping
was at $22.20. The price action is now below that. We must watch as the second
grouping is hit. If the price drops below the bottom of the second grouping I’m
going to stand aside, regardless of what happens. Let’s move ahead in time. See
figure 10.15.

Now this is shaping up much better. The price
has moved above both moving averages and if it continues like this, the
5-period will cross the 15- period shortly. This would be the first trigger
that we were looking for. Notice that the last bar is reversing back down with
a low close. Perhaps the price will now go set a new low, or maybe it will go
straight up. All we can do is watch and wait, and then react if we see the
specific trigger, which we are waiting for, materialize. See figure 10.16.

At this point, the trade would be triggered,
using the first trigger. The price has bounced right off the top of the second
grouping, the moving averages have crossed, and the price is above both of the
averages. Let’s see if this issue gives us the second trigger, or if we
would’ve missed out by not choosing the first trigger (the lesser confirmation ‘moving
average cross’ trigger shown in figure 10.16). See figure 10.17.

DISH has moved up and is now pulling back.
I’ve added a line to show the swing-high that would be used to trigger a trade
using the second of the two trigger methods previously discussed. If the price
takes out the high at $23.48, a trade would be triggered (provided I don’t see
any action before then that I don’t like. For example, if the price retraced
down below a .786 of this new move up, I might think twice. If the new trend is
valid, I’d like the ‘test’ of the low to not be a ‘rigorous’ test.). Let’s move
forward and see if a trade is triggered. See figure 10.18.

The trade is now triggered, using the criteria
of the second trigger. Notice a few things here. There is a gap up, some
trading above the trigger line, and then a fall back towards the middle of the
bar. This bar, in Japanese candlestick terms, is a ‘spinning top’, a bar of
indecision. If I was in this trade, at this point, I would be nervous. Not that
it matters, whether I’m nervous or not, the course of my action is to now let
it play out according to my game plan, but I always rest easier when I don’t
take a lot of ‘heat’ right off the bat. Reality is, sometimes you take heat
immediately and the trade still works great. You must trade your plan,
regardless. See figure 10.19.

This trade is working out quite well. Although
I’m staying away from covering trade management, this would be a time that I
would be thinking strongly about taking partial profits on such a strong
expansion bar up. Let’s continue forward in time. See figure 10.20.

Wow, that expansion bar up was just the start
of the move. I wouldn’t have any ‘seller's remorse’ for taking partial profits,
though, as this move is the exception. Many moves start out strong, and that’s
it. Let’s finish this example with a look at the daily chart. Notice how it
showed no respect for the first grouping, but bounced right on the top of the
second grouping. See figure 10.21.

Remember the three strong down bars going into
the zone? The bars that would scare many people away from the trade? In this
case, the zone held like a rock, and DISH reversed strongly off the area. This
is not uncommon. Sometimes the best trades scare you the most. But understand,
I’m not saying to search for scary trades that look like falling safes, and try
to catch them. I am saying that if a potential trade meets all your trade
criteria and it triggers, that it may just work out quite well, even if the
trade looks downright scary. This may be because it does scare away most
traders, and if everyone took the trade it wouldn’t likely work out, since the
masses almost never win.
By now you should see that the concepts are
really the same, regardless of how deep the retracement is, or what timeframe
the trade is on. The only real difference is that the deeper the retracement is
(the farther away my trade is from the trend that I’m trying to get in on), the
more confirmation I prefer to have.
I don’t want to try and pick tops or bottoms
on my traded timeframe. The closer it gets to looking like a top or a bottom
pick, the more premium I’m willing to pay for added confirmation. Your trading
plan may be different; perhaps you don’t see the need for this added
confirmation. Every trader has their own style, and I can only explain what my
preferences are. I would suggest you explore this idea carefully, though, as
you work on your trading plan.
Advanced Fibonacci Trading Concept : Fibonacci Trading Strategy : Tag: Fibonacci Trading, Forex : Internal Retracements, External retracements, Fibo Expansions, Fibonacci Retracements, Projections - Advanced Fibonacci Trading Techniques