Trend Based Fibonacci Trading
Trend, Fibonacci trading strategy, Trend Based Trading
Course: [ Advanced Fibonacci Trading Concept : Fibonacci Trading Strategy ]
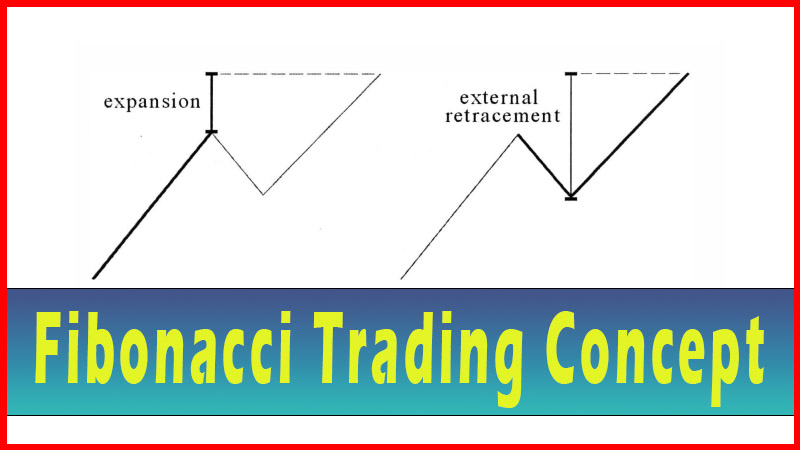
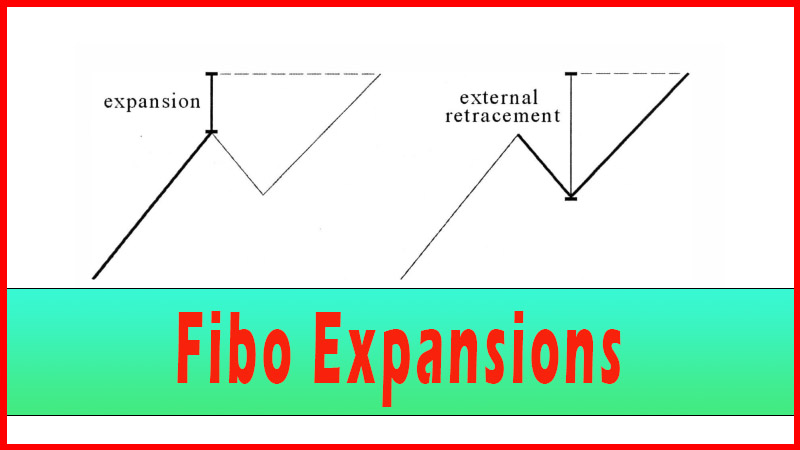
the main reason behind determining the Fibonacci areas is to establish places we think might act as support or resistance. Once an area is determined, a decision must be made on the technique to be used to implement a trade (based on the assumption that the area is a valid support or resistance area).
Trend Based Fibonacci Trading
This chapter and
the following two chapters outlining grouping and trading techniques are where
the meat of the useful nature of this material will be presented. So far, all
the previous material was presented to enable you to: recreate on your own the
following techniques; and experiment with them to suit your own trading needs.
Be proud. You’ve wallowed through all the background mathematics and now are
ready to see what can be done with it.
As discussed
earlier, the main reason behind determining the Fibonacci areas is to establish
places we think might act as support or resistance. Once an area is determined,
a decision must be made on the technique to be used to implement a trade (based
on the assumption that the area is a valid support or resistance area). Now
think about this simple but often overlooked idea. If an area of support or
resistance ‘holds’, the price won’t go through the area. It will act as a
barrier, but it may or may not reverse the price.
When trading, the
usual assumption, if one is using areas of support or resistance, is that the
price action will reverse off the area. The trade makes money because you are
now involved with a new trend. The price may just stop and then go sideways,
but you are playing for the trend to change in the area you are looking at.
What you are doing is betting on a reversal. You are picking a top or a
bottom.
Now wait, I
thought the trend was your friend, and that you never want to try to pick tops
and bottoms. Well, I think that’s generally true. But as I examined many charts
of the trades I was doing, I found that the techniques that I used were just
about always attempting to pick tops and bottoms. Before you get too confused,
let me explain.
For any given chart you will see uptrends, downtrends and sideways periods. But notice an uptrend, for example, how it has small pullbacks as it goes up (recall ‘trees don’t grow to the sky’, from Internal Retracement?). Well, on a smaller timeframe these pullbacks are actually downtrends. So you are down trending at that moment within a larger degree uptrend. You can play that word game over and over by looking at multiple smaller and larger timeframes, finding a near infinite number of uptrends and downtrends on the same chart. See figure 8.1.
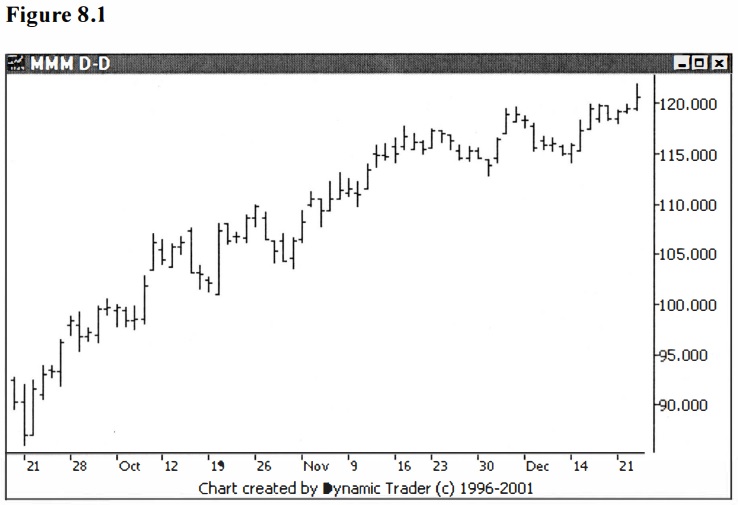
Here MMM is in a
strong uptrend on the daily chart. There are multiple pullbacks where one might
attempt to enter a trade in the direction of this strong uptrend. Let’s look at
the pullback that starts October 29, on a 15- minute chart. See figure 8.2.
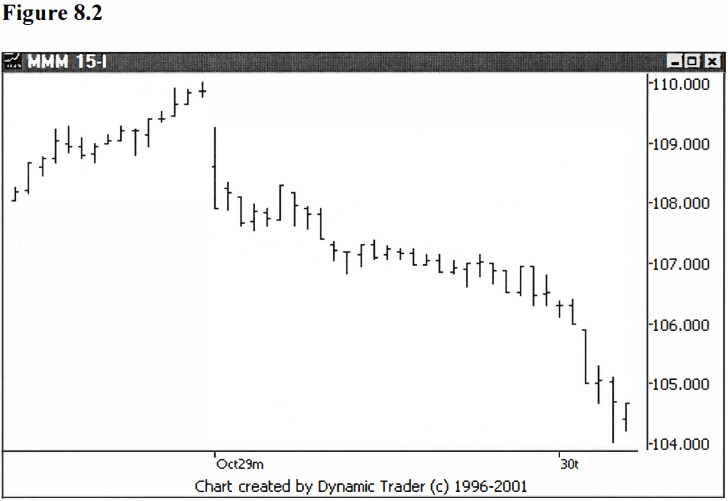
This pullback is a clear downtrend on the 15-minute timeframe, in the context of a larger degree uptrend on the daily timeframe.
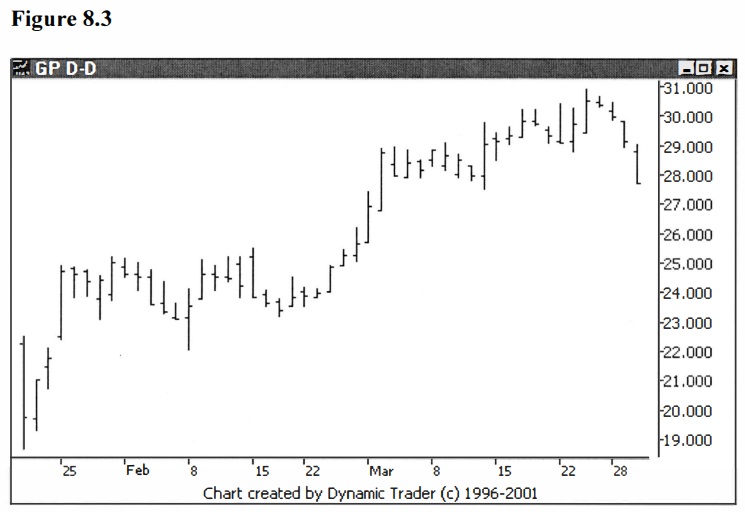
Now, here’s the point. Say you want to stay with the trend, so you find a timeframe that you want to trade, and find an uptrend you want to get on board. You decide that you will enter on a pullback (a very common and highly used technique). You are all about the trend, not fighting the established line of motion, since you know picking tops and bottoms is exceedingly difficult, right?
You decide on the pullback you like, and use any one of many available techniques to trigger you into the trade. Techniques that you hope will tell you when the pullback is over, or likely over. After all, you don’t want to catch a falling knife. So far, so good. You are establishing your position with the trend. See figure 8.3.
Do you see the
problem, though? Dial your chart down to a lower timeframe and look at just the
pullback. See figure 8.4.
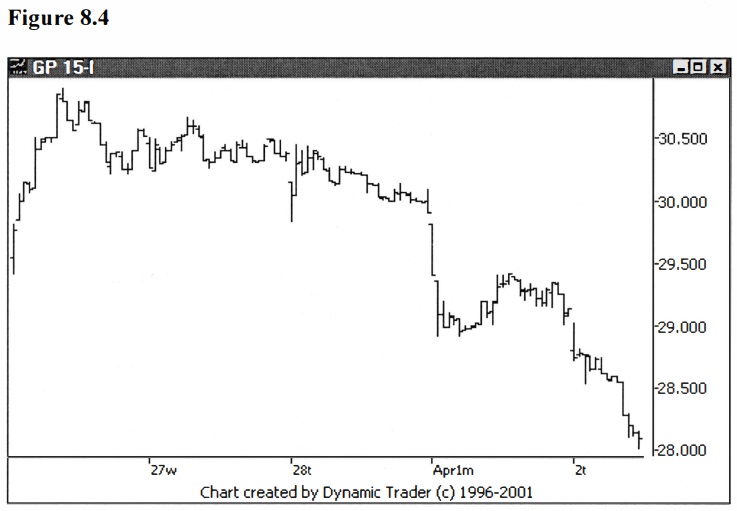
I hope you see
what you’ve just done. You’ve tried to pick the bottom, in this case, of what
looks like a clear downtrend. Now wait, this is exactly what we just said we
were not going to do. In my opinion, this is the trader’s dilemma.
Unless you want
to just buy into a rising market, or sell a falling market and hope it keeps
going, you will be faced with this dilemma. I find it very interesting that
there are many, many references out there that tell you how important it is to
go with the trend, and yet very few will point out what we are looking at right
now. So, what do we do?
I think the first
thing we should take note of is the importance of a given trend. The higher the
timeframe the trend is in, the more important that trend generally is. The idea
is that a trend in motion will stay in motion until something acts to change
that. So, a trend on the daily has more ‘momentum’ than a trend on a 5-minute
chart, all other factors being equal.
For this reason,
I generally follow the common practice of looking at three-time frames when I
trade. First, I determine the traded timeframe; the timeframe that shows a
trend I want to trade. Then I choose a higher timeframe, usually three to five
times as high. I use this timeframe for context, to see if what I think is a
nice trend might actually be a pullback within a larger trend. Lastly, I
determine a ‘trigger’ timeframe; again, usually three to five times lesser than
the traded timeframe.
For example, sometimes I trade on the 5-minute chart with the 15-minute for context and the 1 -minute for triggers. I will also quickly look at the much larger time frames to make sure that I have the overall picture; hence, I would also look at the 60-minute, daily and weekly charts in this case. I just want to make sure there are no surprises waiting that I can’t see on the smaller time frames. See figures 8.5-8.9, with explanations.
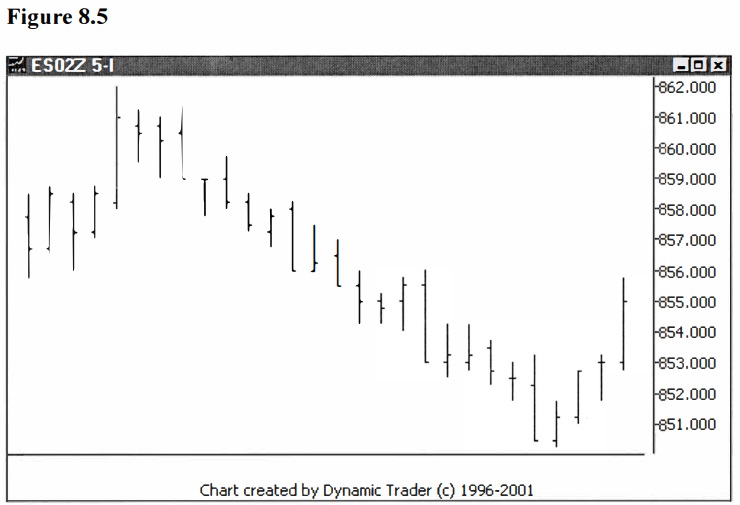
Let’s say I see
this downtrend on the 5-minute chart. A pullback develops and I want to try a
trade with this 5-minute trend. I look at the 15-minute chart to see what the
larger scale picture is for this issue right now. See figure 8.6.
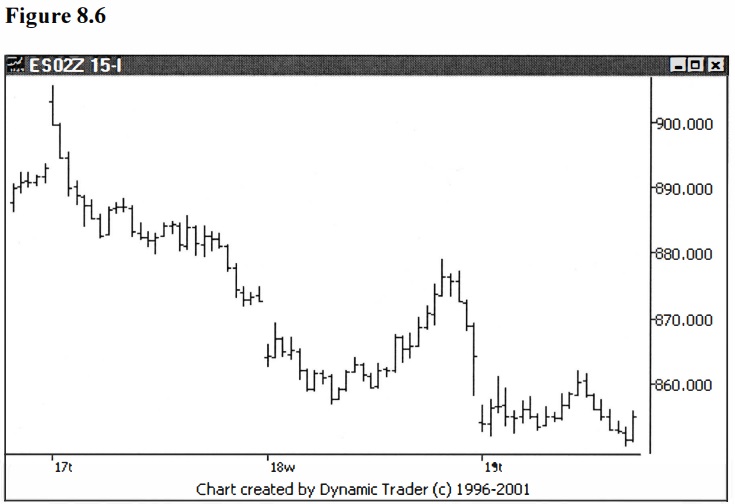
The last bar on this 15-minute chart encompasses the entire three bar pullback from the 5-minute chart in figure 8.5. The perspective is quite different with this additional information. It shows a much larger scale downtrend on the 15-minute chart.
At this point let’s not critique the merits of this trade, or evaluate things we may see on this 15-minute chart. Yes, we all see the possible near exhaustion move down at the end of the previous day that followed a larger than usual pullback, the gap down, the staleness of the trend, the sideways action developing, and so on. Let's Just use the chart right now to determine that the 15-minute chart trend is also down.
Let’s also note that right before the pullback started, the price just broke that last swing-low, so we are in a position where a market decision is likely to be made. The downtrend may be over and this is the typical shake out or we may be in for another leg down. Assuming we are going to take the trade on the 5-minute chart when we feel the pullback is likely over, let’s dial down to the 1-minute and look at that. See figure 8.7.
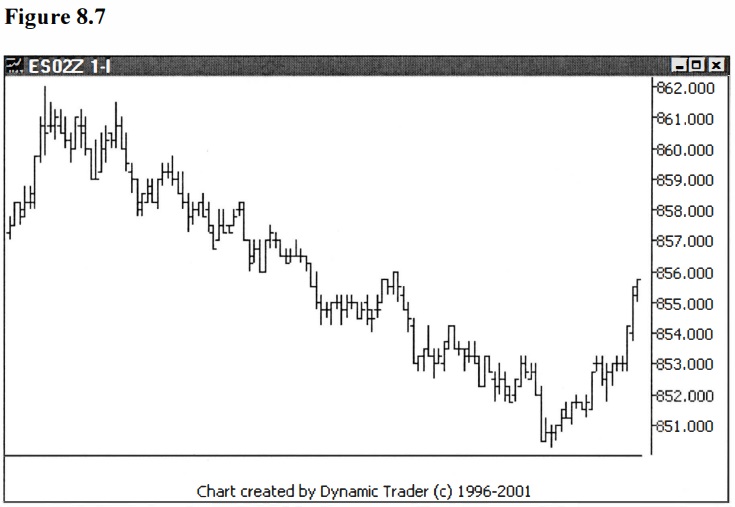
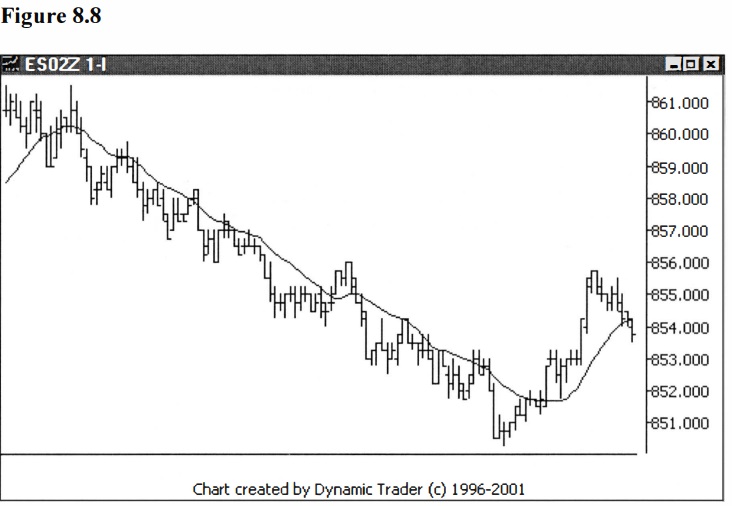
The
trade, as seen in figure 8.8, is now triggered at this point.
Let’s see how
this trade played out. Where you would have taken the trade-off would depend on
your own trading style. If the trade was initiated off the 5-minute chart and
triggered on the I-minute, those may also be good places to look for a plan to
close the trade. See figure 8.9.

The pullback we
have been looking at is the first pullback in the downtrend on this 5-minute
chart (see arrow on figure 8.9). As you can see, there was ample opportunity to
profit on this trade, and despite the reservations previously discussed, this
one did start another leg down.
One of the main
points I want to convey is that we will be looking for trades in the direction
of the trend, and trying to find a point where a pullback may end. The 'traded
timeframe' is determined by the trend that we want to trade. Pick a ’traded
timeframe' that clearly shows the entire trend and the pullbacks. We will then
go down to a lower time frame, and knowing full well that we are trying to pick
a top or a bottom in this counter trend pullback, we will look for a trigger to
do just that, in the context of the larger scale trend.
Sometimes it
seems like the trend that we are following is getting old and has run a long
way. This leads to the temptation to try to pick the end of the run, be it a
top or a bottom (depending on if we are looking at an uptrend or downtrend).
Using some of the Fibonacci calculations you can determine areas where the
trend may end. I want to warn the reader, though; this is a very
low-probability proposition.
I will, instead,
suggest that you dial up to a larger time frame, and look to see if this trend
may be a pullback within a larger trend. If so, calculate possible places for
the pullback to end. These areas where the pullback may end may overlap the
areas calculated for the traded timeframe trend itself to end. Now you have
something similar to what we have been developing all along. You have simply
gone up to trade a higher timeframe. This would likely be a higher probability
trade. The idea is: don’t try to pick when the traded timeframe trend will
end.
Advanced Fibonacci Trading Concept : Fibonacci Trading Strategy : Tag: Fibonacci Trading, Forex : Trend, Fibonacci trading strategy, Trend Based Trading - Trend Based Fibonacci Trading