Fibonacci Numbers
Fibonacci Numbers, Fibo trading, Fibonacci Retracements, Fibonacci trading course
Course: [ Advanced Fibonacci Trading Concept : Fibonacci Trading Strategy ]

Most traders stick with the basic Fibonacci series of numbers. It might be argued that adding more numbers to the mix will only serve to make the techniques too complicated, and there is a lot to be said for keeping the game plan simple.
Fibonacci Numbers
Most traders
stick with the basic Fibonacci series of numbers. It might be argued that
adding more numbers to the mix will only serve to make the techniques too
complicated, and there is a lot to be said for keeping the game plan simple. On
the other hand, a simple plan that everyone else can also see is likely to have
some serious noise. By noise I mean you will likely see a lot of price
fluctuation in the area of the trigger. I try to strike a balance between just
the basics and too much.
First, I’d like
to examine two very commonly used ‘Fibonacci’ numbers, the .500 and the 2.000.
As noted, before, these aren’t ‘true’ Fibonacci numbers, but are numbers often
used in trading plans that use the Fibonaccis. I began to wonder if there were
numbers in these areas that could be derived directly from Phi (the Golden
ratio), or from phi (the reciprocal of the Golden ratio).
Recall from
Chapter 1 that we derived the .382 by squaring the .618. Next, I tried
multiplying this .382 (which is .618 times .618) by .618 again. This gave me
.236, a number I recognized. In my vast reading on Fibonacci in trading I had
seen the .236 used fairly frequently. See figure 6.1
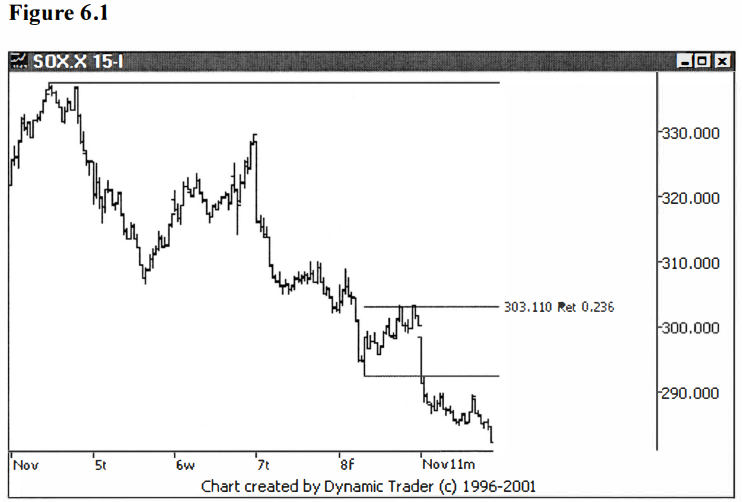
In deriving the
.382 and the .236, then, all we are doing is taking additional .618 ratios of
the .618 starting point. From here I took the square root of this .236 I had
just derived and I got .486.
Now, this was
very close to .500 and was derived directly from Phi. For those inclined
towards math, this route was essentially  ,or the square root of .618 cubed. I continued
to play on my calculator, looking for other routes to get this same number. As
mentioned before, there is usually a multiplicity of ways to get these numbers.
They seem to interrelate with each other like some giant web. This added
credence, to me, that these numbers weren’t just some random creation.
At this point I
wondered what the .618 of the .786 would be, so I tried that. Bamm, there’s the
.486 again. Now I was sure this was very closely tied in with the common
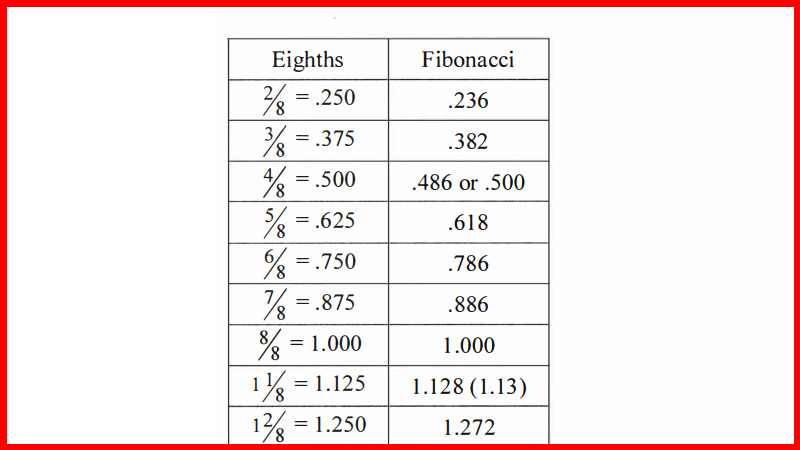
Fibonacci numbers. For my purposes, I had my Fibonacci ‘50% retracement’
number.
Next, I wanted
the number that would correspond with the 2.000. Since the 2.000 is the
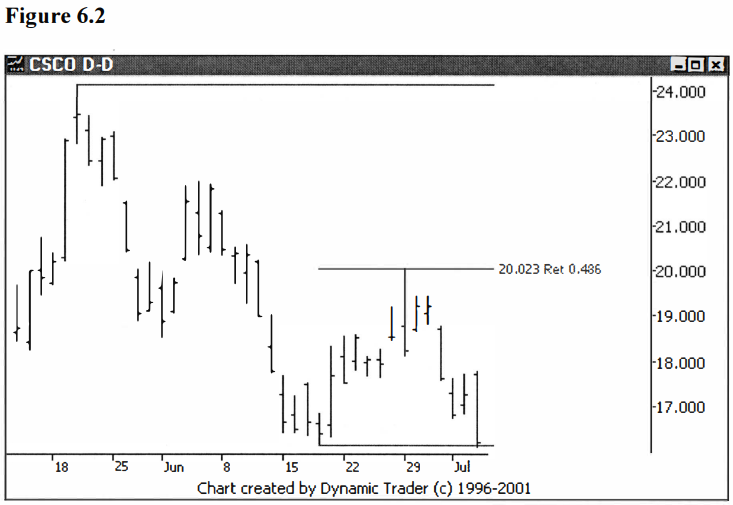
reciprocal of the .500, I just flipped the .486 over and got 2.058.
I now had the
Fibonacci number for the 2.000 external retracement. I would guess more than a
few readers are saying, ‘But those are so close, what does it matter?’
In actual trading
reality, it may not. Or it may be that those trades that overshoot the 2.000
(because of stop gunning, or too many traders piling on, or whatever) may go
right to the 2.058. And trades that fall shy of the .500, may be stopping right
on the .486. Regardless of whether or not this small amount is truly important,
I wanted to work with numbers derived directly from Phi. See figures 6.2 and
6.3.
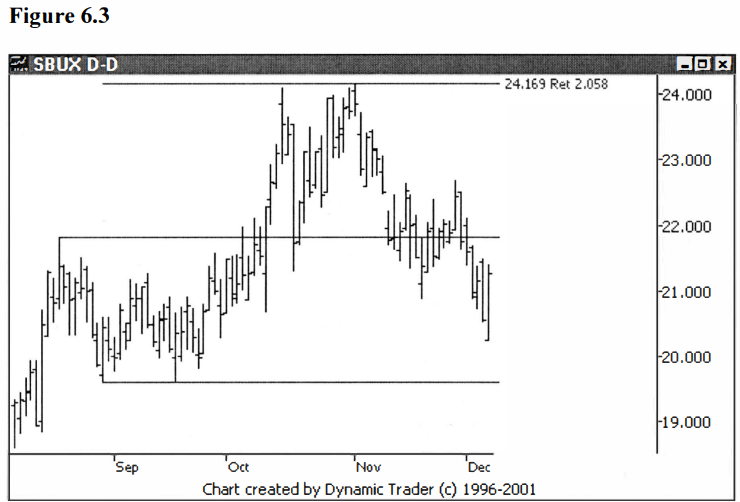
Notice, in figure
6.3, before we move on, how choppy SBUX trades. It tested the $19.60
retracement area twice before finally going up and testing the $24.17 area,
again twice, before finally reversing trend. This could be quite a challenging
stock to trade.
Now, here comes
one of my best discoveries. In meetings with Scott Carney over at Harmonic
Trader, he was showing me patterns that consistently went through the .786 by a
fairly regular amount. We saw this over and over, and I began to wonder if
there might not be a Phi derived number in that area. I actually stumbled on it
fairly quickly once I began playing with my calculator, something I probably
should be embarrassed to admit I do regularly.
I noted to myself
that .786 was the square root of .618. So I took the square root of .786. I
figured if taking the square root of the .618 was a valid concept, then taking
the square root of the . 786 (essentially the fourth root of the .618), was
just as valid. The number came up, .88665... Technically if you round it up it
would be .887. Truncated it was .886, and that was easier to remember because
it ‘rhymed’ with the familiar .786. Hence the ‘886’ was born.
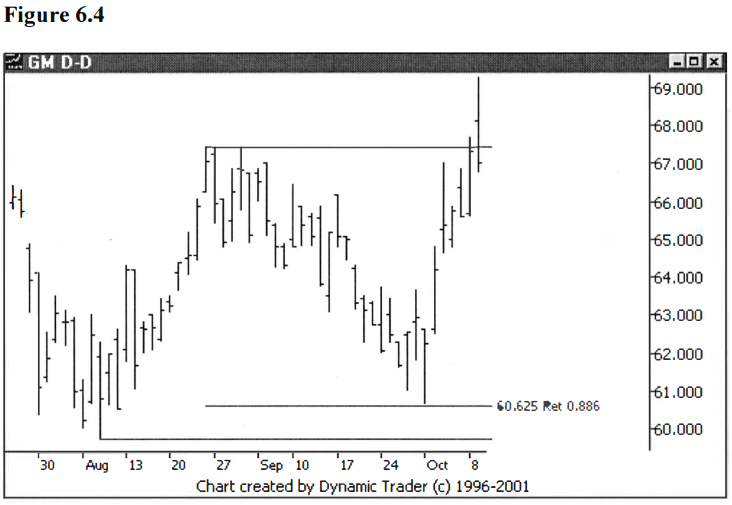
I then went to
many of the charts Scott and I had looked at and 1o and behold they were
stopping on the .886 with near exact precision. I was quite astounded how
precise it was. I looked at many more charts and the .886 seemed to be a very
significant number. Since I discovered this number Scott has went on to develop
a pattern around it and I am working on a pattern where this number is
critical. See figures 6.4 and 6.5.
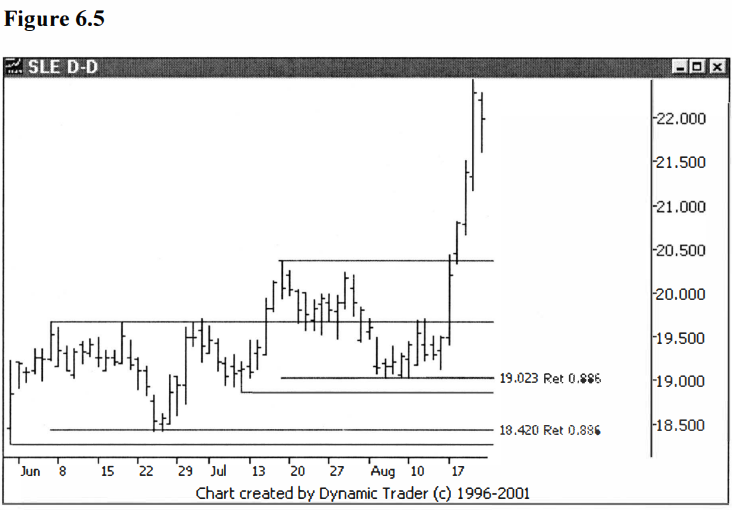
Hopefully, figure
6.5 is clear enough to follow, as it shows two successive .886 retracements.
I feel the .886
is the most significant number in my arsenal at this time. This significance
may be because it is still a fairly new and unknown number (at least until this
book gets out!). Or it may be because the .786 has gotten to be so well known
that if the .786 is overshot it will wind up at the .886. I don’t know if this
is why the .886 seems so significant, nor do I care why it may be. All I care
is that, for my own trading purposes, I want to add it to the mix when
appropriate. See figures 6.6 and 6.7, with explanations.
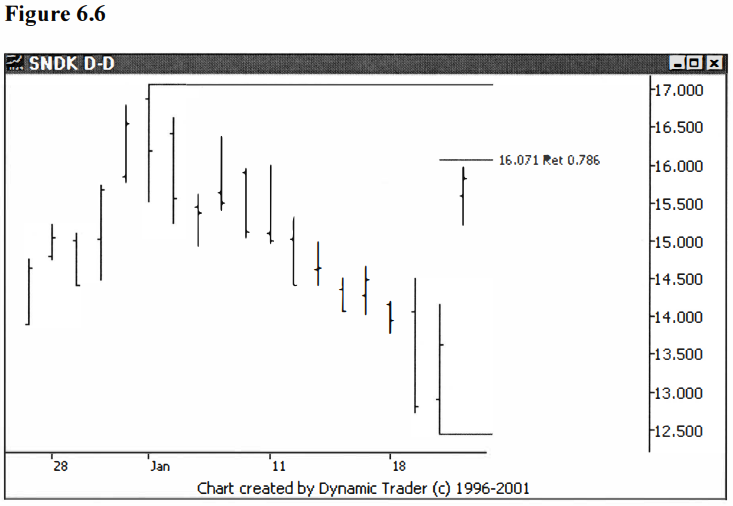
Here we have a
strong gap up reversal and we are watching the .786 as a possible stopping
point. Let’s look at the next chart to see what actually happened.
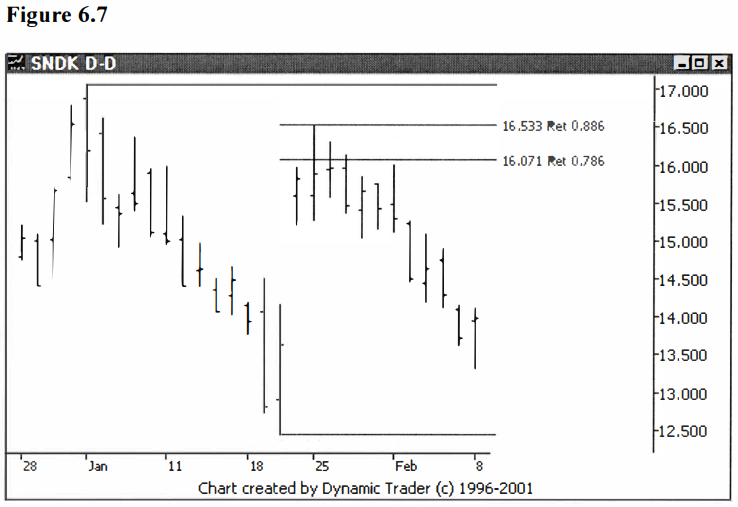
The issue moved
right through the .786 and reversed hard right at the .886.
Here’s an interesting
case, also, of yet one more thing that you may see. Here we have what appears
to be a nice .786 reversal. See figure 6.8.
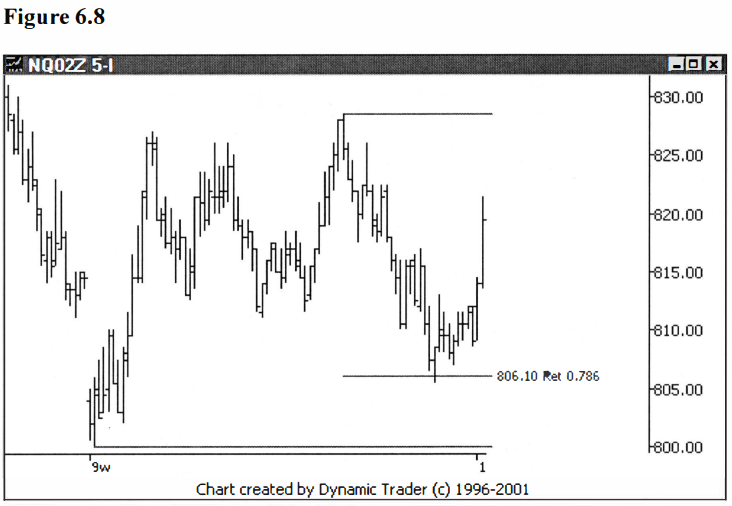
But look at what
happened shortly after this chart was captured. See figure 6.9.
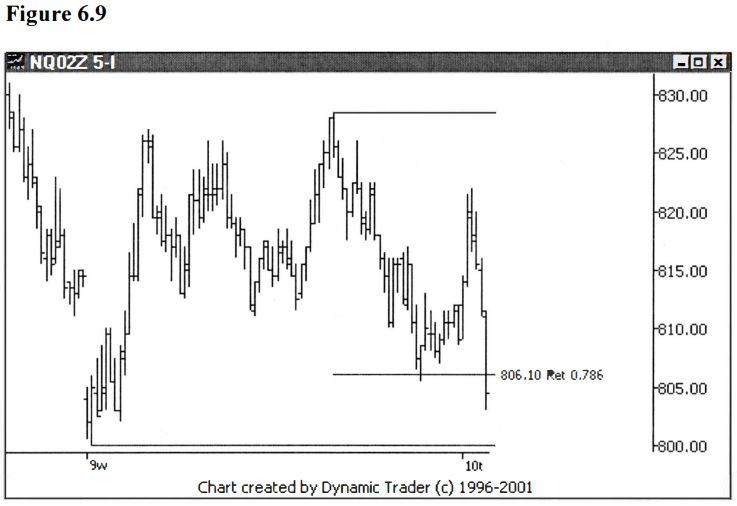
The issue
reverses and breaks the .786. Now, let’s see how it played out further ahead in
time. See figure 6.10.
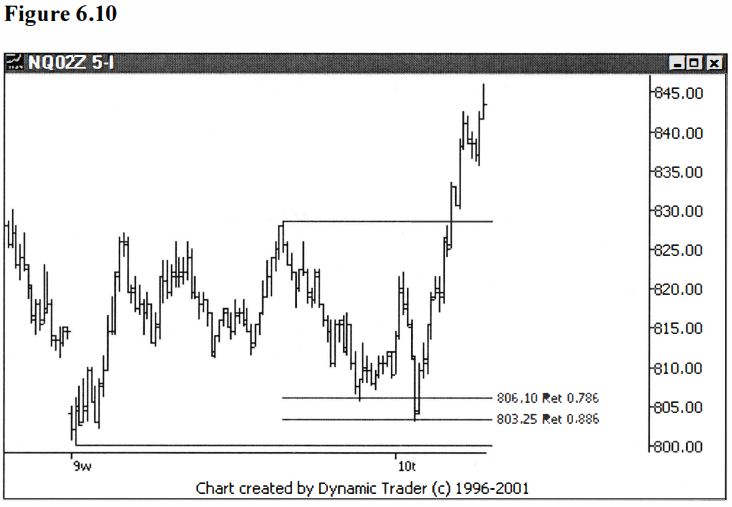
It went back to
the .886 and put in the final reversal. Sometimes the . 786 simply doesn’t
hold, and sometimes it provides a bounce and then is broken after the bounce.
Let’s continue
on. Since every time I have derived a Fibonacci number I have also calculated
its reciprocal, I immediately flipped the .886 over to discover one of the most
fascinating things I’ve found since studying the markets: the ‘one one three’.
The reciprocal of the .886 is 1.128. Although I’ve tried to keep to three places past the decimal in all my presentations of the Fibonaccis, I’m going to break with that convention here and call this one the 1.13. Now granted, the three decimal places I list for most of these Fibonacci numbers aren’t necessary for trading; that’s more precise than is practical. I think this convention came from starting with the three decimal places in the .618, which has become a quite well known and popularized number.
Although most
writers keep it at the .618, a few round to .62. For the 1.272, though, almost
all references just go with 1.27. Hence when I derived this 1.13 number (which,
in keeping with how all these numbers cross reference, is also the square root
of the 1.27), I decided to just round it to two decimal places and go with the
1.13. To the best of my knowledge, this is the first time this number has been
quantified.
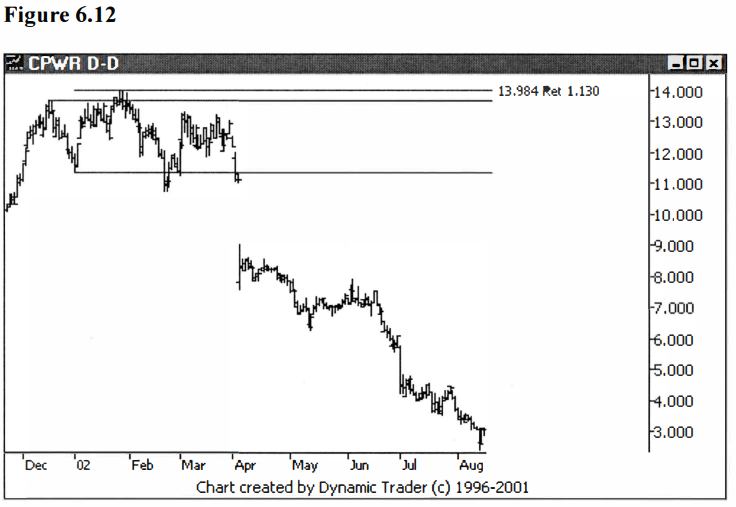
So why was this
so fascinating? Well, many, many times I saw the ‘double tops’ and ‘double
bottoms’ slightly exceeded, and then tum and rocket off in the opposite
direction. This was the so-called ‘shake out’, false breakout, gunning for the
stops or whatever one wants to call it. It’s also seen in many popular false
breakout strategies. But now I am quantifying it. I found a great deal of these
moves that just exceeded the double tops and double bottoms were stopping very
near the 1.13.
This allowed me
to see where a shake out may go. Furthermore, it allowed me to make a judgment
as to when I felt that a breakout was a real breakout, or was just a head fake.
If I was finding the .886 was the most significant number I was working with, I
would have expected the 1.13 to be very significant, too. In practice, I found
that the assumption was valid. See figures 6.11 and 6.12.

So at this point
we have added the following numbers to our basic numbers:
.236, .486, .886,
l.13 and 2.058.
There is one more number I like to use that I haven’t seen in any trading references, although I suspect it has been used here and there. I noticed a fair amount of issues just shy of the 2.000/2.058 area. Again, does this happen for ‘harmonic’ reasons, or because many traders are watching the 2.000 area and are jumping in early, or none of the above? I don’t care. All I care about is trying to determine areas where I tend to see things happen that I feel might help my trading, things that might give me an edge. The reason behind it is of no consequence to my immediate trading. I only harp on this because I want to point out my emphasis is on the chart, not on trying to discover the fundamentals behind the chart. If you feel those fundamental reasons are important for you to know, by all means pursue that. I just prefer to trade off the chart for the most part.
I started playing
around with different geometric figures that had Fibonacci lengths on them, to
see if anything interesting popped out. The most obvious layout to me was a
‘golden’ rectangle, a rectangle whose longer side was 1.618 times the length of
its shorter side. As you may recall from our earlier discussion, this is the
rectangle that was universally found in studies to be the most pleasing to the
greatest percentage of people. So I constructed and labelled a rectangle with
the sides of 1.000 and 1.618 and I drew in a diagonal. See figure 6.13.

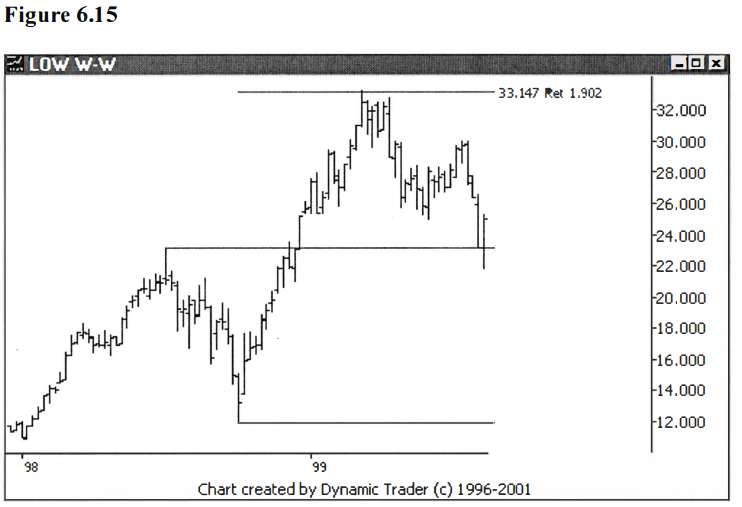
I immediately
wanted to know what the diagonal length was, so I did some quick high school
math and found it was 1.902. Now here was a number that was just shy of the
2.000/2.058 area, and I stumbled upon it quite quickly. I started looking at
charts and found this did look like an area I wanted to watch. See figures 6.14
and 6.15.

In doing the high
school math to calculate the diagonal, I noticed a few numbers I’d seen before.
Here’s the Pythagorean theorem applied to the triangle in figure 6.13 (sorry to
all those out there that hated high school math).
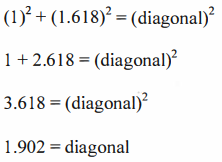
Not
only did I get the 1.902 I was looking for, I noticed 2.618 and 3.618.
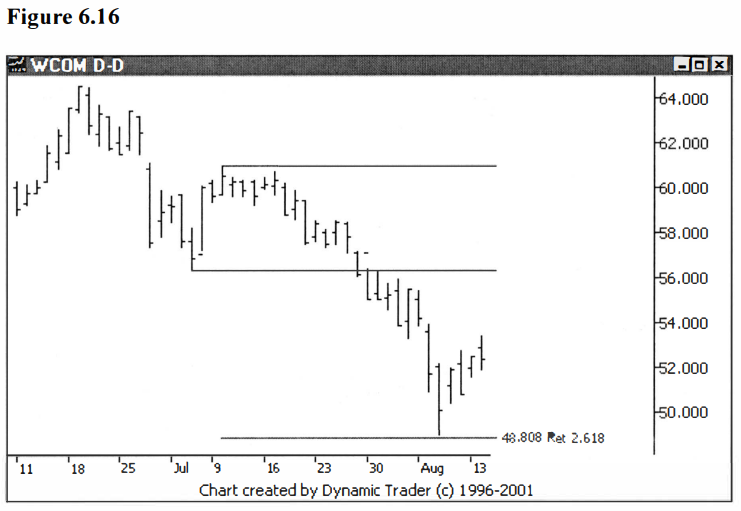
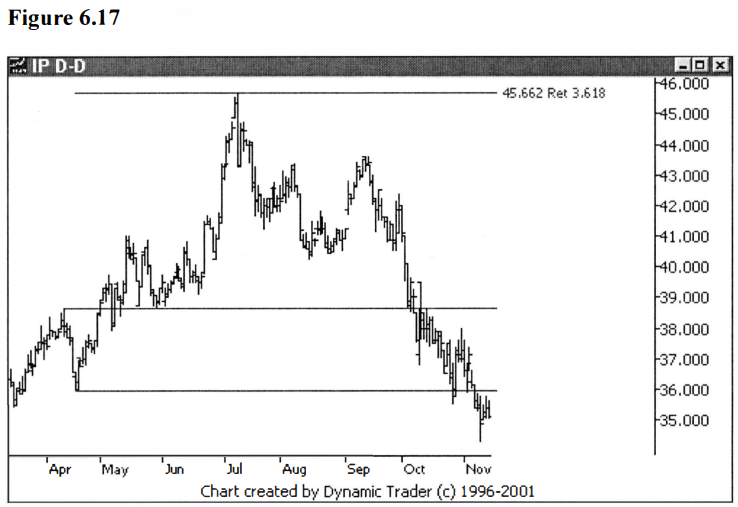
The 2.618 is a
fairly commonly used external retracement. As can be seen from the above
derivation, it's just Phi (1.618) squared. I also noticed in my own studies
that there may be an area around three and a half or so, and that might be it.
These are pretty extreme external retracements, but you do see some extreme
moves that come up occasionally. See figures 6.16 and 6.17.
Let’s add in a
few more extreme external retracements while we are in this area, and we’ll sum
up what we have and call it quits. I think we have plenty to work with. Notice,
up until now, whenever I decided to add a number into the group I also liked to
add its reciprocal. This only makes sense: if a number is valid, the number ‘on
the other side of 1.000’ should be, too.
We haven’t
determined what the reciprocal of the .382 is yet, so let’s do that one:
As you guessed,
this isn’t a coincidence. We’ve seen that the numbers are frequently derived in
multiple ways. So at this point I’m sure I want 2.618 in the group. I also
haven’t flipped over the .236:
Here’s a number
you will see in many references, usually as the 4.24. It is also generally the
most extreme external retracement I will look at. See figure 6.18.
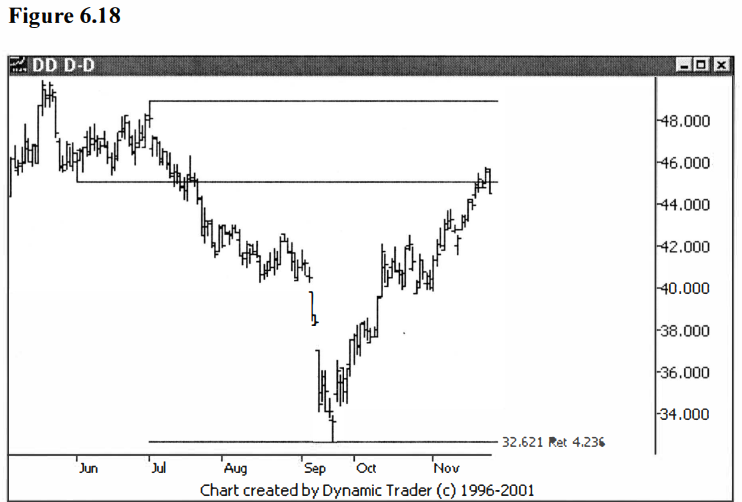
Now we have all
the Fibonacci numbers we need for our group, and all the numbers are matched
with their reciprocals. I’m sure you are glad to be done with all that, but
I’ll have to disappoint you temporarily, as I want to add three more numbers
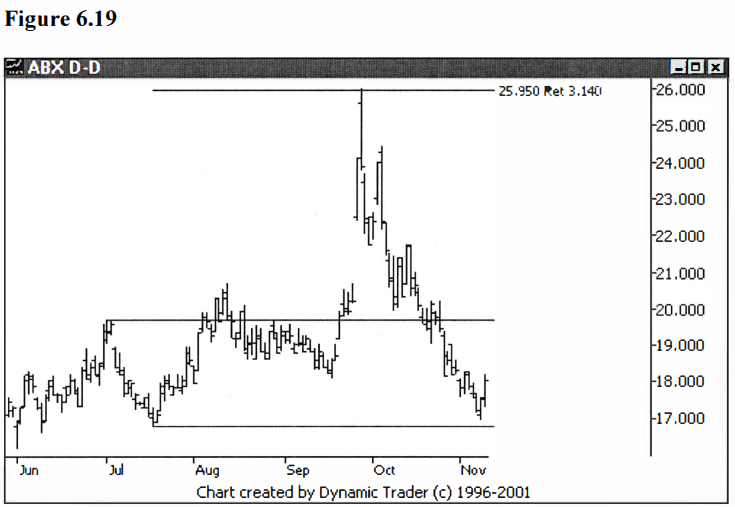
into the group. First, I want to add in a non-Fibonacci number, but one we know
is related to Fibonacci, as we discussed earlier. I want to add in pi (π):
3.14. I’ll just use two decimal places, since that’s how it is referred to most
often. I first learned about this one from Scott Carmey. He’s used it quite a
bit in his book, and especially on his website with some of his new patterns.
See figures 6.19 and 6.20.

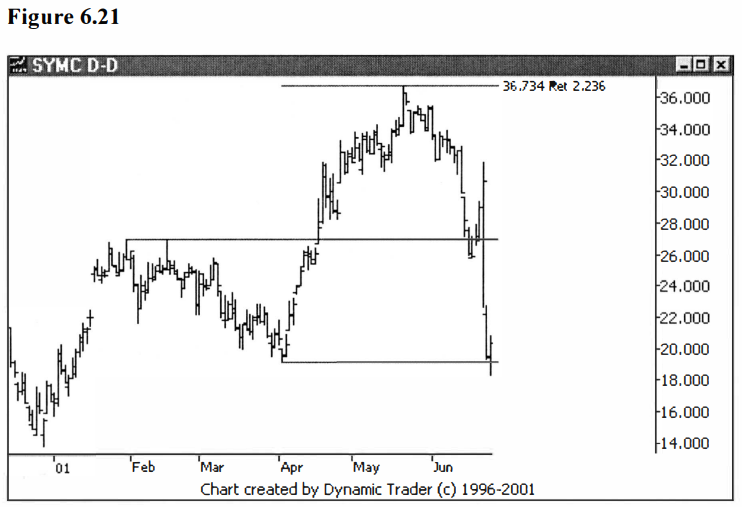
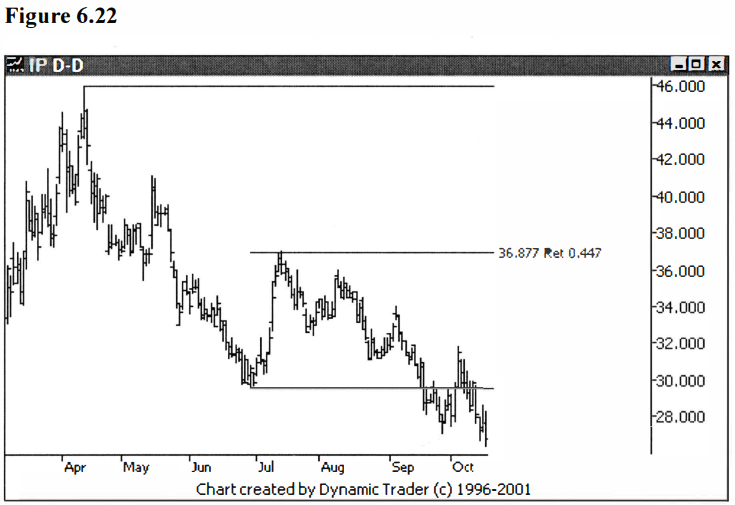
Second (do you
believe me this time?), I want to add in 2.236, frequently rounded to 2.24.
This number is the square root of 5. Recall how, way back, we started out with
Phi, the golden ratio, and the formula was the square root of 5 plus 1, all
divided by 2. I’ll leave it as an exercise for the reader to see if he or she
can show whether the 2.236 is a ‘true’ Fibonacci number, or not. Lastly, let’s
flip this one over to get .447, and stop there. If I don’t stop now,
I may just keep
adding them on and lose the rest of my readers. See figures 6.21 and 6.22.
Let’s sum up our
rather extensive list of numbers:
0.236, .382,
.447, .486, .500, .618, .786, .886, 1.000, 1.13, 1.272,
1.618, 1.902,
2.000, 2.058, 2.236, 2.618, 3.14, 3.618, and 4.236.
I would like to
add one final comment before we proceed to the next chapter. The use of the
square root of2 (which equals approximately 1.414), and its reciprocal
(approximately .707), have become increasingly popular to use in the same
manner as the Fibonaccis. I do see a lot of moves that turn right on these
numbers. Now, again, I don’t know if this is due to the increasing popularity
of these numbers, or the fact that they lie right in between the .618/.786 and
1.272/1.618 areas, and are logical spots for overshoots. Or is it for another
reason? I can’t say. I only know they are numbers that seem to be points at
which a move may tum.
For now, I won’t
add these in, or we will have so many numbers they will begin to lose any
sense. I merely wanted to point them out so that the reader will be aware of
them, and can do further research if so inclined. I will say that I have found
two Fibonacci derived numbers that are very close to these two ‘square root of
two’ numbers. I may present the numbers in future material, but the dilemma is
certainly arising about how many numbers are practical to work with.
Advanced Fibonacci Trading Concept : Fibonacci Trading Strategy : Tag: Fibonacci Trading, Forex : Fibonacci Numbers, Fibo trading, Fibonacci Retracements, Fibonacci trading course - Fibonacci Numbers


