Fibonacci Expansions
Internal Retracements, External retracements, Fibo Expansions, Fibonacci Retracements
Course: [ Advanced Fibonacci Trading Concept : Fibonacci Trading Strategy ]
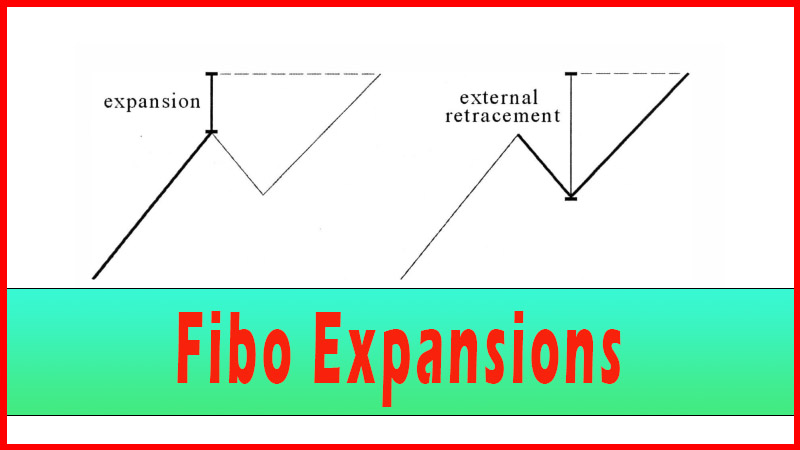
The expansion is the technique I probably use the least, although it may have more promise than I generally have attributed to it. This is an area few traders look at, and as such it may offer the most promise for additional research.
Fibonacci Expansions
The expansion is
the technique I probably use the least, although it may have more promise than
I generally have attributed to it. This is an area few traders look at, and as
such it may offer the most promise for additional research. The idea is simple
enough; you just want to look at how far beyond the last swing-high a move
might go. Just like an external retracement carries beyond the previous
swing-point high or low, an expansion does, also. It’s all a matter of how you
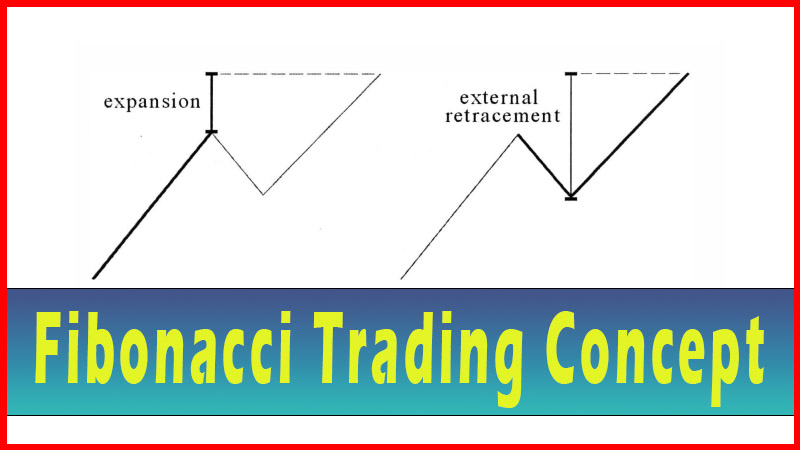
measure the move. Let’s look at figure 5.1 for a comparison.

Using an uptrend
as an example, the expansion adds a Fibonacci ratio of the trend move on to the
top of the swing-high, whereas the external retracement does a Fibonacci ratio
(of greater than 1.000, say a 1.272 or 1.618) of the pullback and adds that
amount to the point where the pullback terminates. For an expansion in the case
of a downtrend, one just ‘flips’ the procedure over, subtracting the Fibonacci
ratio of the trend move from the swing-low. 1 find these two methods will
frequently give you nearly identical areas. See figures 5.2-5.4, with
explanations for each chart.

Figure 5.2 shows
a .382 expansion. Notice how .382 of the initial moves is simply added to the
swing-high point. The pullback amount is not used in the calculation.

Figure 5.3 is the
same chart as figure 5.2, but with the more familiar external retracement, in
this case a 1.618. Notice how close the 1.618 retracement price of$24.71 is to
the .382 expansion price of $24.72.

Figure 5.4 shows both the .382 expansion and the 1.618
retracement on the same chart. Although the chart is somewhat unclear because
of the close overlap of the two numbers, it is worth presenting an unclear
chart here for two reasons. First, to show how close these numbers can actually
be at times. Second, when we get to the chapter on groupings, we will have to
create charts with not just two overlapping prices but sometimes with many.
Best not to shy away from it now, with only two numbers overlapping.
Expansions can be
used with all variations of Fibonacci. I’ll present two more examples here, a
.500 and a .618, but you are by no means limited to these in your studies. See
figures 5.5 and 5.6.


As traders, you need to decide if you want to add this additional
expansion technique to your game plan. When we get to the chapter on groupings
I will provide two examples where I use an expansion in the mix. I will provide
the two examples
Advanced Fibonacci Trading Concept : Fibonacci Trading Strategy : Tag: Fibonacci Trading, Forex : Internal Retracements, External retracements, Fibo Expansions, Fibonacci Retracements - Fibonacci Expansions
