Fibonacci Price Grouping
Fibonacci Numbers, Fibo trading, Fibonacci Retracements, Fibonacci trading course
Course: [ Advanced Fibonacci Trading Concept : Fibonacci Trading Strategy ]
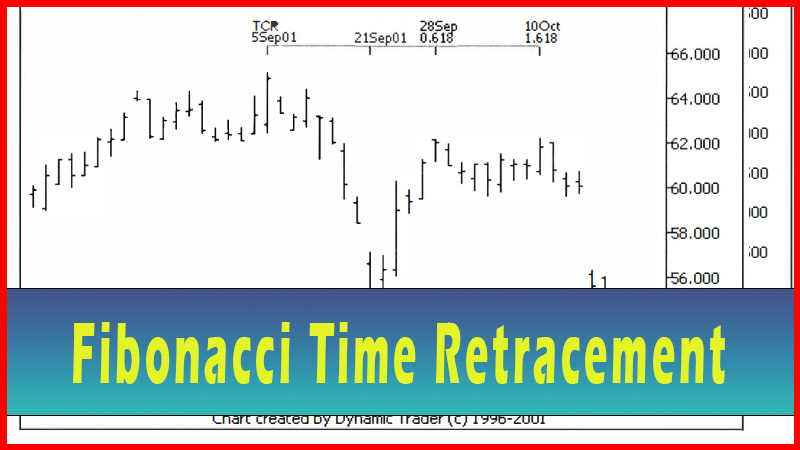
Every calculation, so far, was a variation on price. We took ratios of prices, and added them to other prices, and so on. But ‘time’ is also passing (as we look for trades and watch them develop), and it seems as though ‘time’ is just as harmonic as ‘price’.
Adding Time to the Mix - Fibonacci Trading
Up to this point, we have only looked at
price. Every calculation, so far, was a variation on price. We took ratios of
prices, and added them to other prices, and so on. But ‘time’ is also passing
(as we look for trades and watch them develop), and it seems as though ‘time’
is just as harmonic as ‘price’. It would only make sense to add time
calculations to your trading arsenal.
I am only going to do a small primer here on
this topic, although at some point I may do a work devoted entirely to the
concept of harmonic time calculations. I want the reader to be aware of the
concept, and to start to research and experiment with the concept.
For simplicity’s sake, let’s start by just
looking at some examples where we have a trend, and then the trend corrects.
1’11 choose these examples such that we have a fairly deep correction (not just
a small pullback), and then the trend continues. The question on a trader’s
mind might be, ‘Will this thing stop correcting and the previous trend
re-establish itself, and if so, when?’ Let’s just look at some simple Fibonacci
time retracements like .618 and .786. See figures 11.1-11.3.


Let’s also look at some Fibonacci time
retracements that are greater than 1.000, such as 1.618. See figure 11.4 and
11.5.


Notice how KMB, in figure 11.5, is very choppy
and discontinuous, yet the pullback ended exactly on a 1.618 time retracement.
Also interesting to note is that the chart shows an internal price retracement,
whereas the time retracement would be ‘external’ i.e. greater than 1.000. This
example, perhaps, lends credence to the idea of ‘giving a trade time to work’,
as long as the original premise of the trade remains intact.
This chart also provides a test for the
reader’s eye, and shows how harmonic KMB is trading, despite the choppiness. Do
you see it? Let me show you the same chart, with one more time retracement
added on. See figure 11.6.

KMB first ended its price retracement at
exactly a .618-time retracement and began to fall off. It then went
sideways-to-up, and set a very nominal new high, just twelve cents above the
high set at the .618-time retracement. This nominal new high was set exactly at
the 1.618-time retracement, and this time the retracement was complete.
Although the chart looks very helter - skelter, the stock was actually trading
quite harmonically.
In conclusion, let’s recall how we’ve seen
many examples of corrections as they approach a Fibonacci price grouping, and
have considered possible trade opportunities. But what if we also saw this
happen at a Fibonacci time retracement? This would seem to strengthen the
probability of a zone holding. This would be something a trader might consider
when making a decision in a zone. What if an issue went into a Fibonacci price
grouping, triggered a trade, and it happened at a Fibonacci time retracement?
Now I can hear some readers asking ‘Hey, can
you do groupings of time, just like with price?’ (I hope some of you are saying
this. If you are, I will feel this work has taught you something!) The answer
to the question is ‘yes’. Fibonacci price grouping, Fibonacci time grouping,
and a trigger. Hmmm. I hope this has you thinking. For now, I will leave it to
the reader to experiment with this, and if I do a work on time harmonics it
will revolve around time groupings. Also note that the Dynamic Trader software I
used for the charts in this work can do many variations of time groupings.
Advanced Fibonacci Trading Concept : Fibonacci Trading Strategy : Tag: Fibonacci Trading, Forex : Fibonacci Numbers, Fibo trading, Fibonacci Retracements, Fibonacci trading course - Fibonacci Price Grouping
