Be on Guard for Changes
chart patterns, trending market conditions, price changes, learn how to exit the trade
Course: [ The Candlestick and Pivot Point Trading Triggers : Chapter 2. Determining Market Condition ]
I must reiterate that no one, no matter what, can foresee the future. Therefore, you must be aware that changes can and do occur.
BE ON GUARD FOR CHANGES
I must
reiterate that no one, no matter what, can foresee the future. Therefore, you
must be aware that changes can and do occur. You must understand what drives
these changes as reflected on the chart patterns. Once you can master
identifying what drives price changes or trending market conditions, then you
need to learn how and when to execute a trade based on those signals. Then the
next phase is to manage the risks of the trade and to learn how to exit the
trade to harness the profits accrued in the trade.
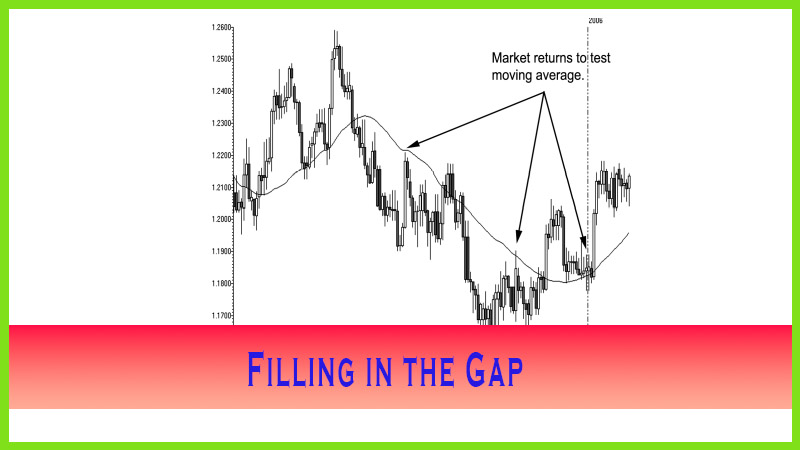
I will
teach you how to spot these changes and what you can do to protect yourself
from giving back profits by scaling out of trades, which will be covered in
Chapter 10. First, you need to be aware of the process that markets go through.
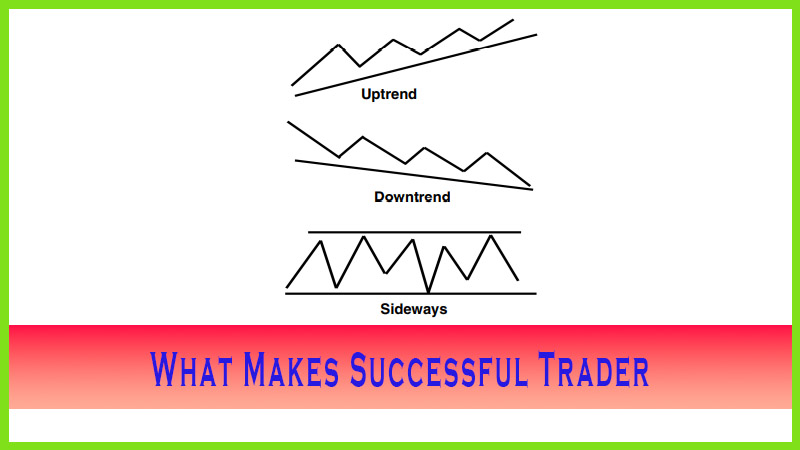
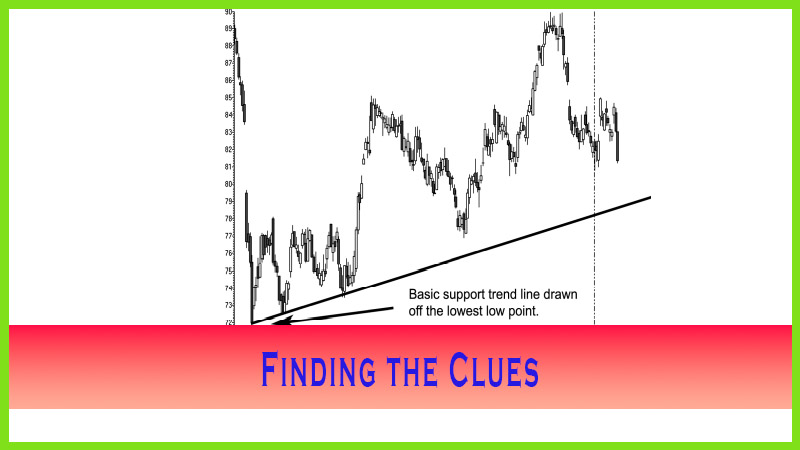
Prices do go in trend mode as we have covered so far. From a technical
standpoint, there are certain clues that candle charts illustrate to show you
the true condition of the market. Pivot point analysis will also help guide you
as to price targets, either the high or the low or both of a given session. If
you have the understanding that markets can either continue the original trend
or reverse it on a dime, then you will be able to filter out preconceived
emotional opinions rather than “fight the tape,” as it is called. You will read
that the mind can, will, and does play tricks on you when you are trading. So
you need to focus on what the market is showing you at the current moment.
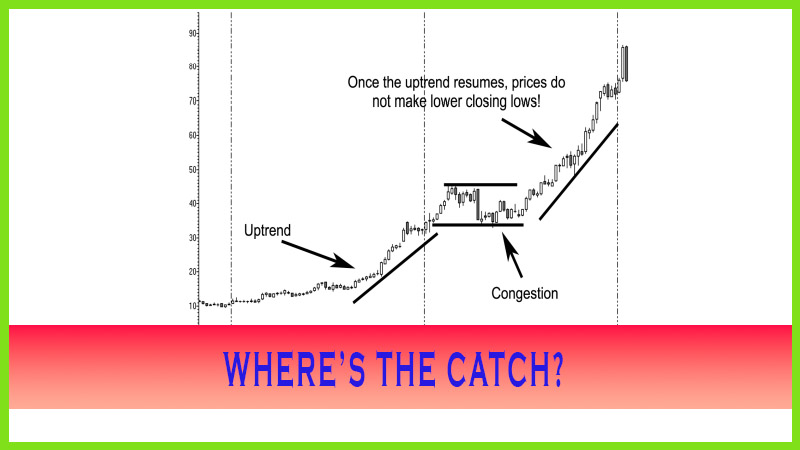
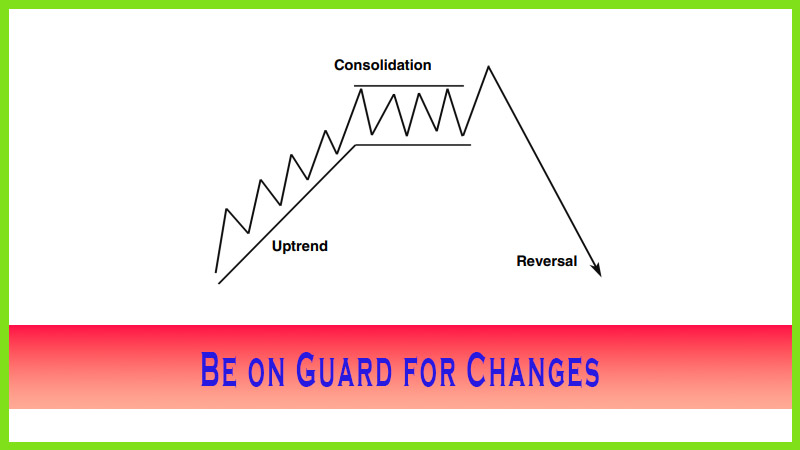
The graph
in Figure 2.7 seems a bit harsh that a market condition could be so bullish and
yet completely fall apart at the seam after a consolidation period.
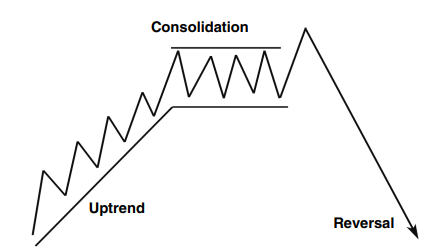
What can and usually does happen is that a
trader gets a preconceived notion that the value of a given market should
continue to move in one direction. Most traders will continuously buy breaks
after a consolidation period. Granted, that might be a correct notion; but it
might not be the correct move, especially when proven wrong by the markets’
conditional changes as highlighted by specific candle patterns.
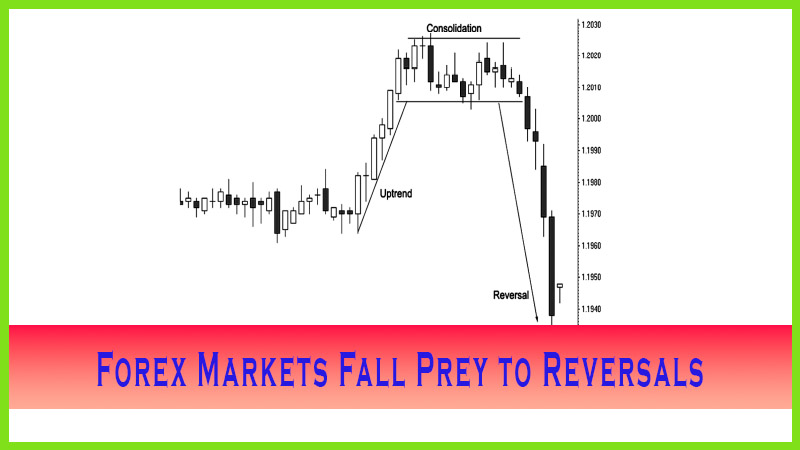
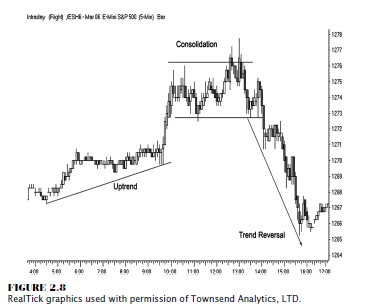
As you
can see in Figure 2.8, the 5-minute e-mini-Standard & Poor’s (S&P)
chart shows how a market moves from bullish (or an uptrend) to the
consolidation phase to a complete trend reversal. Drawing a simple trend line
would help you identify a breakdown of the support; but the one most important
element that signaled a trend reversal was the fact that once the market traded
below the consolidation sideways channel support more specifically, closed
below that level and remained below the channel support level you had
sufficient evidence to identify that the market’s bullish condition had
changed.
The Candlestick and Pivot Point Trading Triggers : Chapter 2. Determining Market Condition : Tag: Candlestick Trading, Stock Markets, Pivot Point : chart patterns, trending market conditions, price changes, learn how to exit the trade - Be on Guard for Changes