Finding the Clues
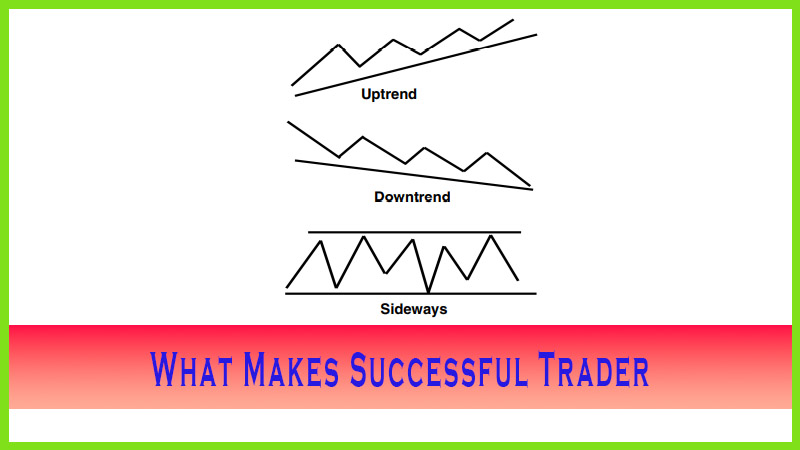
Down trend, up trend, Period separator, sideways channel
Course: [ The Candlestick and Pivot Point Trading Triggers : Chapter 2. Determining Market Condition ]
From a strict chart-reading perspective, finding the clues as to when a trend is nearing completion is a matter of watching the relationship of the close of the time period for which you are trading to past highs and lows.
FIND THE CLUES!
From a
strict chart-reading perspective, finding the clues as to when a trend is
nearing completion is a matter of watching the relationship of the close of the
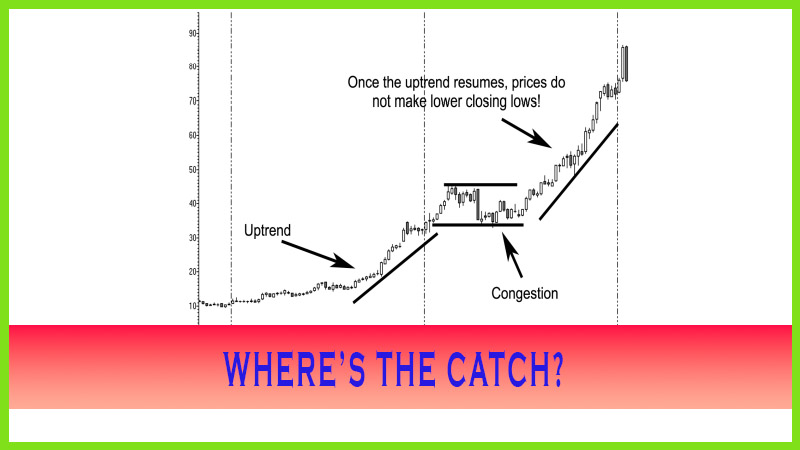
time period for which you are trading to past highs and lows. If you study the
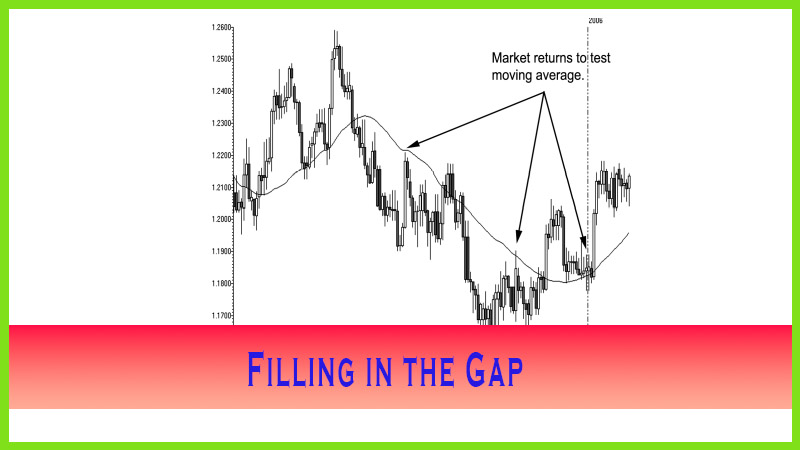
chart in Figure 2.3, you will see the first leg or run-up in the market from
September 2004 until the first lower closing low occurred in March 2005. The
market never made a lower closing low during that time period. Once it did, the
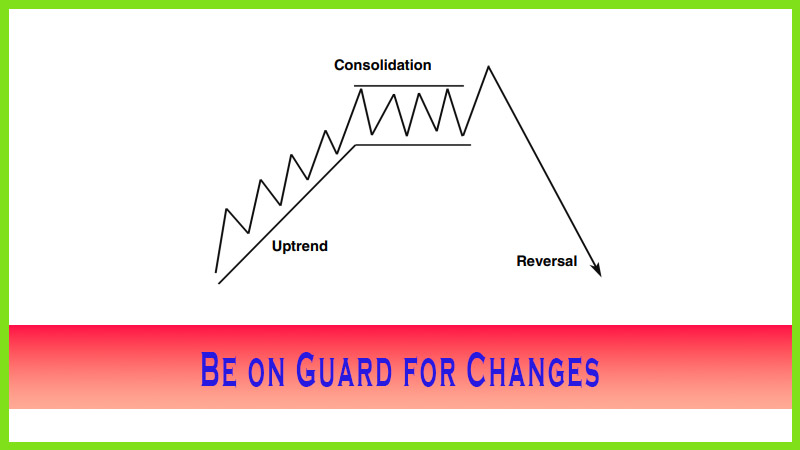
market entered a consolidation phase. That was the first conditional change.
The sequence of higher highs, higher lows, and higher closing highs stopped;
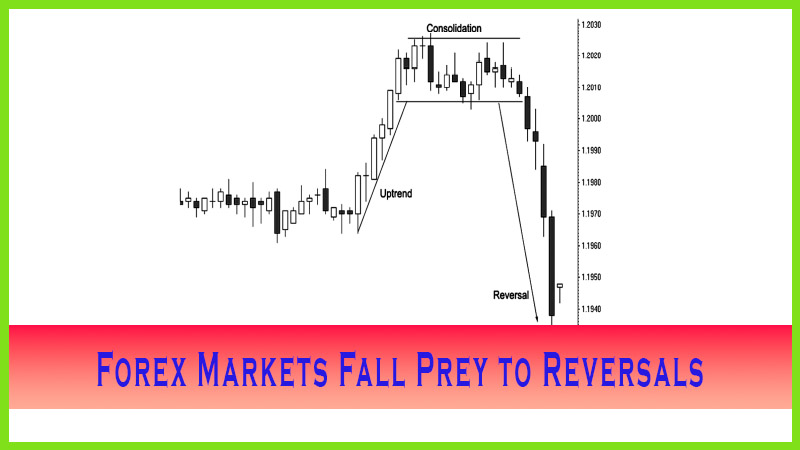
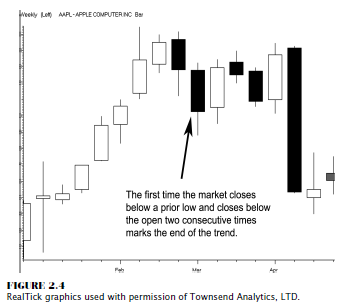
and a new conditional change occurred the market made a lower closing low and
closed below the open twice in a row. The chart in Figure 2.4 zooms in on that
specific area to help highlight what occurs when a trend pauses or exhausts
itself.
As
traders, we are searching for information that will give us clues to an
advantageous entry spot to go long, whether it is at the beginning stages of a
bottom or breaking out of a congestion phase or a sideways channel. Determining
the market condition, whether it is bullish, bearish, or neutral, is what will
help us in our trading decisions. There are many forms of technical analysis
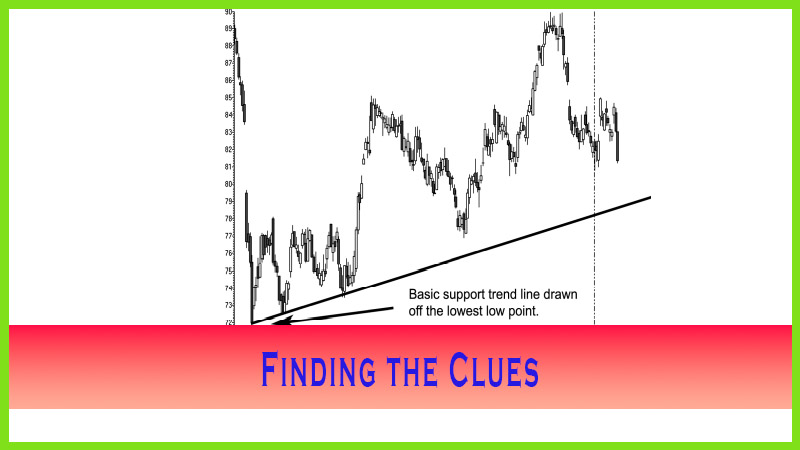
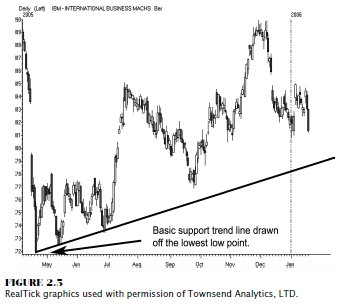
studies to help us achieve that. The best form of trend analysis is the simple
trend-line approach; you start with the lowest low point and then draw the line
up until the next corrective low point. Figure 2.5 demonstrates the most common
way to draw a supporting trend line. After a long hard crash in IBM, a low was
made on 4/17/2005 at 71.85 (the Weekly Pivot Point S-1 targeted a low of
72.50). Drawing a line from that low and extending it out to the second
reactionary low and extending forward illustrated a rising trend. As the market
kept bouncing near that support line (S-1), it advanced higher. Using this form
of simple analysis will help you identify the market’s condition and,
therefore, develop a trading plan or keep you focused to buy breaks.
As for
determining a bearish or downward trend, you need to draw a line from a peak,
or top, in the market, as shown in Figure 2.6. You have a series of lower highs
to draw a resistance trend line. Start with the first peak, extend the line
downward to the next high, and then extend the line forward. This will help you
remain focused that the market is bearish, and therefore you want to focus on
selling opportunities.
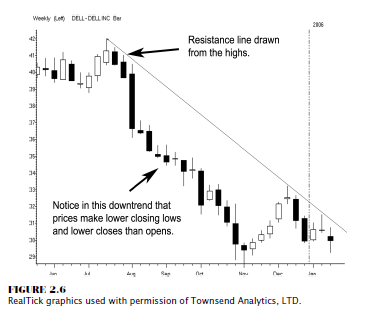
As the
trend line is drawn from the top and extended down to the next high, notice
that the highs are touching the newly drawn resistance line as the market
pushes away from the trend line. Also notice the sequence of events that occur.
It is the opposite of what we saw in a bull trend: Prices are making lower
highs and lower lows and closing below the opens (as indicated by the dark
candles); but more important, prices continually close below the prior time
period’s low. In addition, the downtrend does not end until late November, when
prices reverse these negative conditions. The conditional changes that occur on
the way down reverse at that time with higher highs, higher lows, higher closes
than opens, and, once again, the most important feature of all, higher closes
than a prior period’s high.
The Candlestick and Pivot Point Trading Triggers : Chapter 2. Determining Market Condition : Tag: Candlestick Trading, Stock Markets, Pivot Point : Down trend, up trend, Period separator, sideways channel - Finding the Clues