Forex Markets Fall Prey to Reversals
countertrend trade, trend reversal, manipulate prices, forex market’s liquidity, pivot point method
Course: [ The Candlestick and Pivot Point Trading Triggers : Chapter 2. Determining Market Condition ]
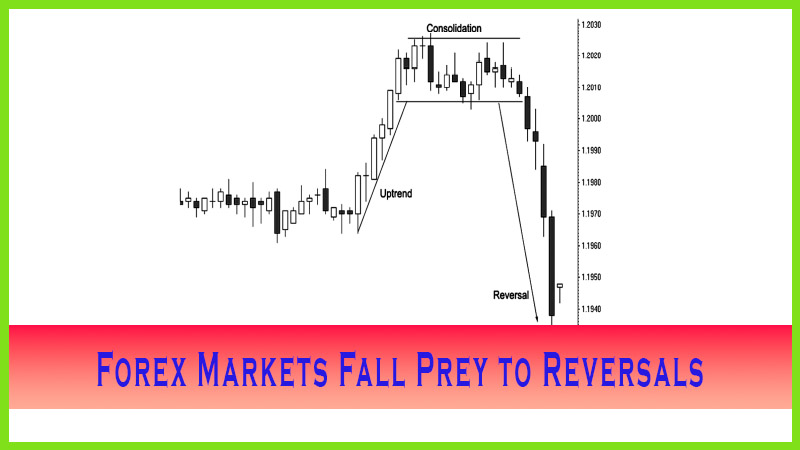
Let’s examine a market that is not correlated to stocks, such as the euro currency, to see how this market phenomenon known as a trend reversal occurs.
FOREX MARKETS FALL PREY TO REVERSALS
Let’s
examine a market that is not correlated to stocks, such as the euro currency,
to see how this market phenomenon known as a trend reversal occurs. Keep in
mind that the markets are a reflection of the cumulative total (or sum) of
market participants’ perceived value of a given product at a given time. We
went over the fact of how massive the spot forex market’s liquidity is; not a
single entity can manipulate prices. Something or some event must drive
traders’ opinions of the markets. One such event is a news or economic report,
which can change people’s opinions on a given market’s value.
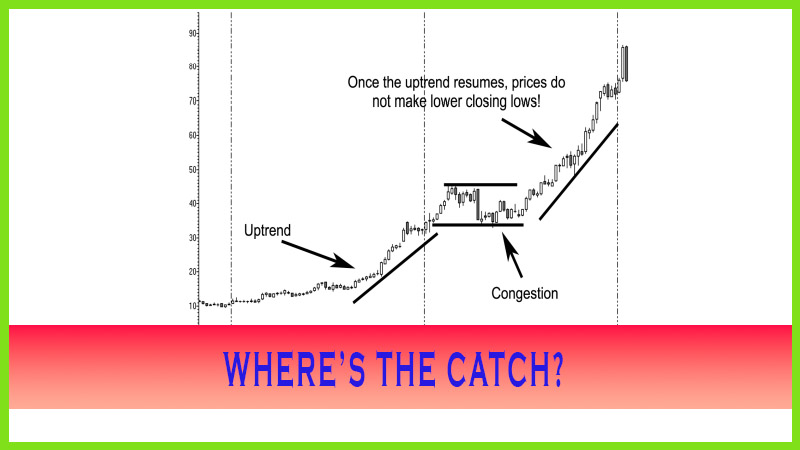
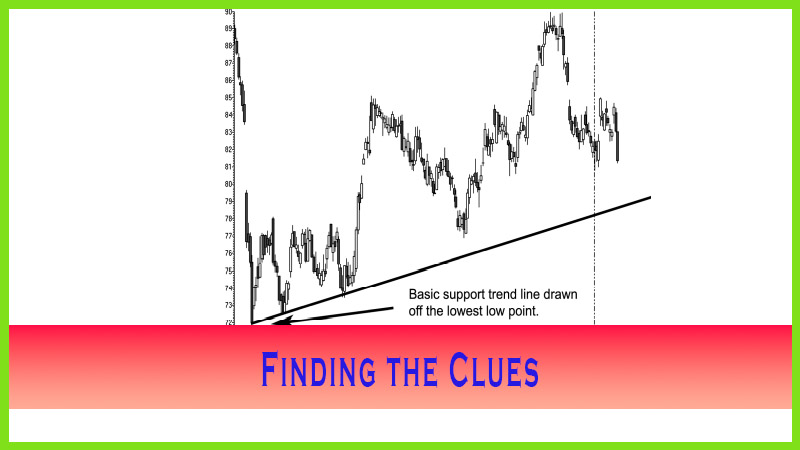
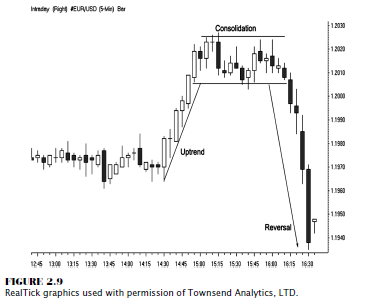
As we
look at the euro currency chart in Figure 2.9, we see the market develop into
an uptrend, then consolidate, and then, bang, on the drop of a dime, drastically
reverse. This is the kind of trading environment in which traders can and do
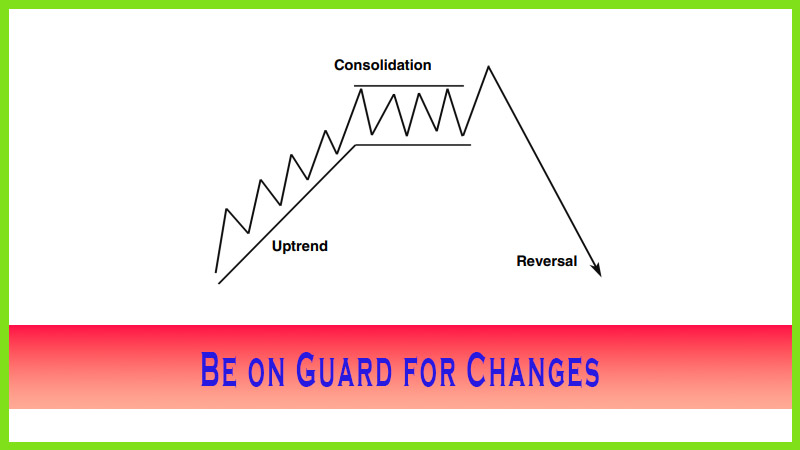
make lots and lots of money. If you know what to look for and if you understand
once a market goes from trend to consolidation, you should be aware that the
next possible outcome might not be a trend continuation but rather a complete
trend reversal. Then you have a better chance of not fighting against the
current of the market, otherwise known as the tape.
MOVING AVERAGES HELP!
The next
method for identifying whether the market is bullish, bearish, or in a
consolidation phase is utilizing moving averages. The most familiar one is the
benchmark 200-day moving average. Most technicians and short term traders feel
this is a worthless time period, with which I agree for short to
intermediate-term trading.
Remember
that the idea in using moving averages is to help determine the true direction
of the market. The longer the time period used in a moving average, the less
effective it is for shorter-term trading. Keep in mind that a 200-day moving
average is over 28 weeks, more than half a year. The Federal Reserve raised
rates four times in 2005 in that same time period. That leaves way too much
time and, more important, distance between prices and the moving average to
generate buy or sell signals.
When using moving averages the general guideline is simple:
- If prices are above the moving average, look to buy pullbacks or to take buy signals, as the market is in a bullish mode or in an uptrend.
- If prices are trading below the moving average, look to sell rallies or to take sell signals, as the market is bearish or in a downtrend.
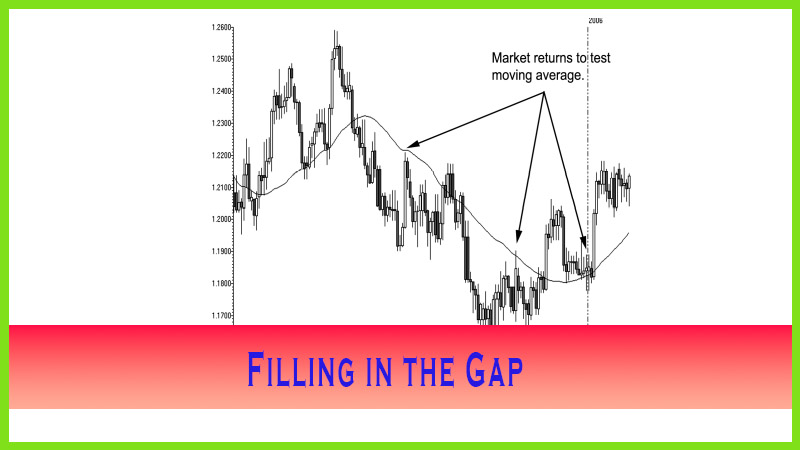
Another
instance in which traders use moving averages in helping their trading is
determining what is called “regression to the mean.” This is a term many
traders hear but really do not understand. It refers to the condition when
prices deviate too far from the mean or average. At that time, prices will
regress, or return, to the average; or the market will pause or consolidate until
the average catches up to the price. You will notice what I call a “gap band”
signal. This is what will occur when the prices gap too far away from the
moving averages or bands and give a trader an opportunity for a countertrend
trade. Another way to describe this is that when a market deviates, or departs,
too far from the moving average, it gives an opportunity for a speculator to
take advantage of this condition, which generally ends up with prices reaching
an unsustainable extreme and then returning back toward the moving averages for
a short term price swing. The question is at what distance or price level do
prices deviate, or move too far away, from the moving average before market
prices return to the moving average or the market pauses in order for the
moving average to catch up to the prices.
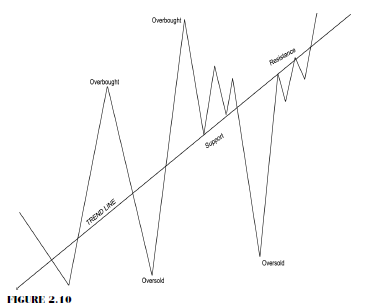
As you
can see in Figure 2.10, the market trends higher; but at times we see reactions
that shift values from one extreme to another. How do we use moving averages
effectively? More important, which time frames and which set of conditional
settings should we employ to give us a true sense or value of the market? We
will cover a different concept using a pivot point method later in the book.
Right
now, I want to set the foundation behind the principle of why we use moving averages
to help determine bullish, bearish, or neutral market conditions and how to
trade these conditions. I try to figure out not why a market moved, but rather
where the market is now in relation to specific points of interest, such as
past opens highs, lows, and closes.
The Candlestick and Pivot Point Trading Triggers : Chapter 2. Determining Market Condition : Tag: Candlestick Trading, Stock Markets, Pivot Point : countertrend trade, trend reversal, manipulate prices, forex market’s liquidity, pivot point method - Forex Markets Fall Prey to Reversals