Presence of Catch
trend phase, False breakouts and reversals, bullish chart patterns
Course: [ The Candlestick and Pivot Point Trading Triggers : Chapter 2. Determining Market Condition ]
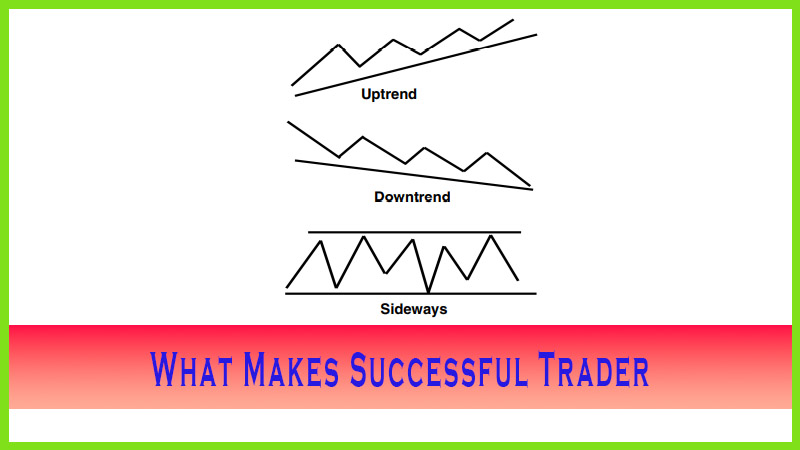
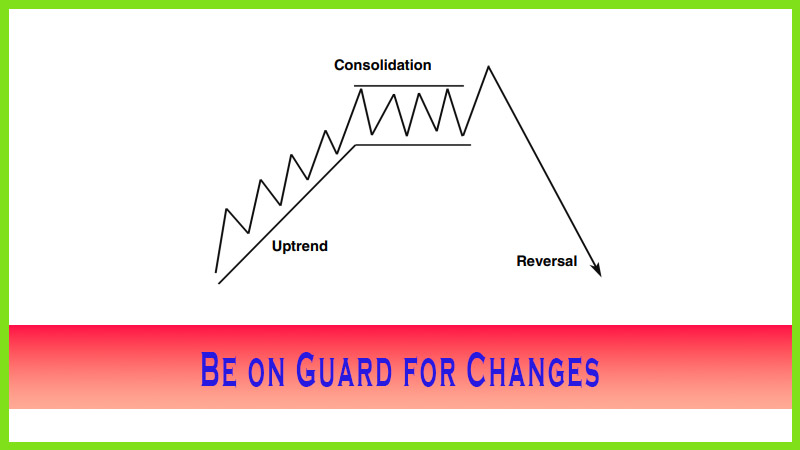
As the market starts to trade higher once, it enters a trend phase. Generally speaking, the market will pause or consolidate before resuming the uptrend.
WHERE’S THE CATCH?
As the
market starts to trade higher once, it enters a trend phase. Generally
speaking, the market will pause or consolidate before resuming the uptrend.
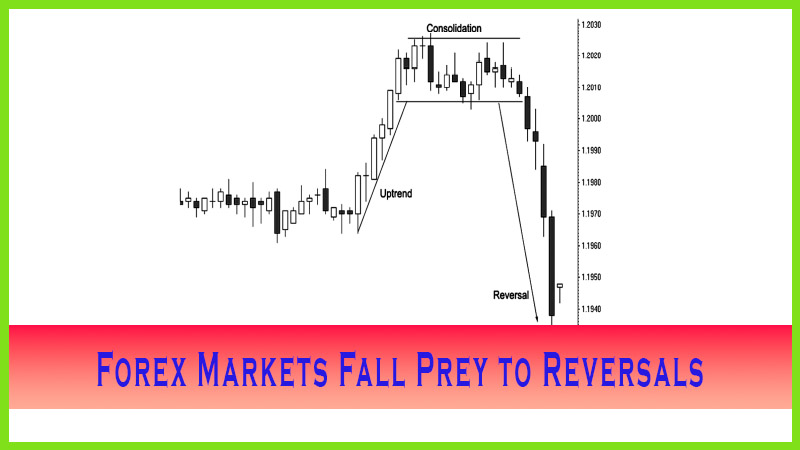
However, there lies the catch and what substantiates the Random Walk theory.
Not at all times do markets resume an uptrend from the consolidation phase.
False breakouts and reversals do occur. Most bullish chart patterns, such as
flags, pennants, rising wedges, and ascending triangles, are just an assortment
of classical technical continuation patterns that exist in trends. These work
in bar charts and candle charts. The larger patterns tend to give a clue to
the next move by forming in the direction of the trend; the smaller corrective
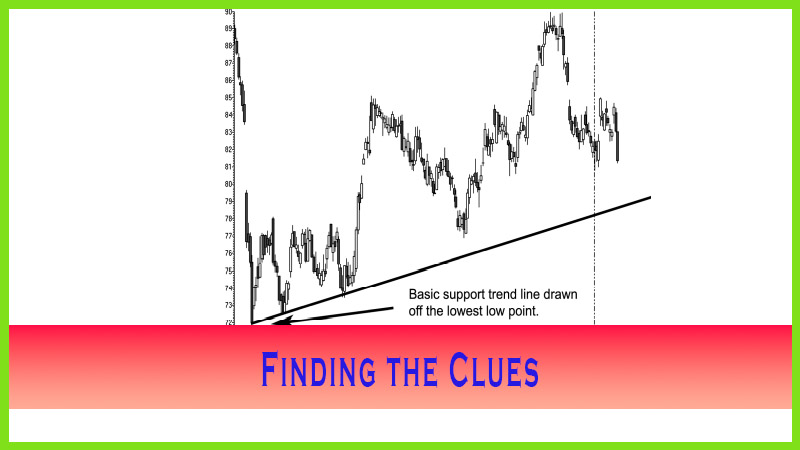
patterns, such as flags and triangles, lean away from the trend. Sideways
channels that form after a bullish trend have a tendency to support off a past
breakout point or an old high.
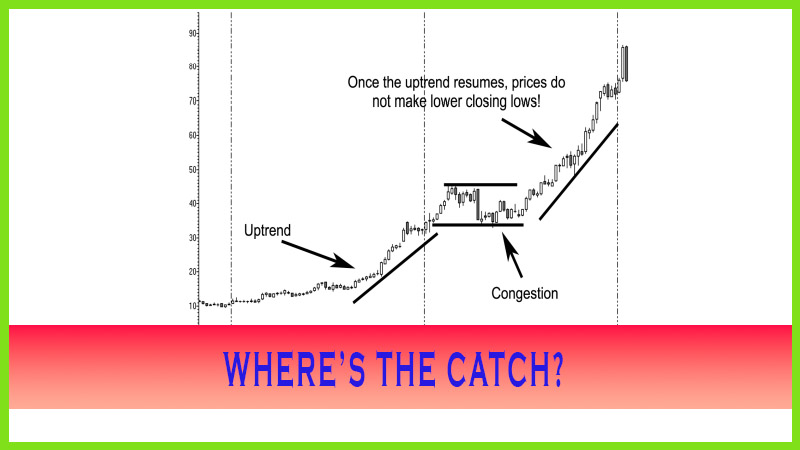
Figure
2.3 shows weekly chart of Apple Computer; it had an amazing run after it went
out of a period of congestion and blasted off to the upside. Notice that after
the bullish price direction resumed, prices do not make lower closing lows
until the second week in December.
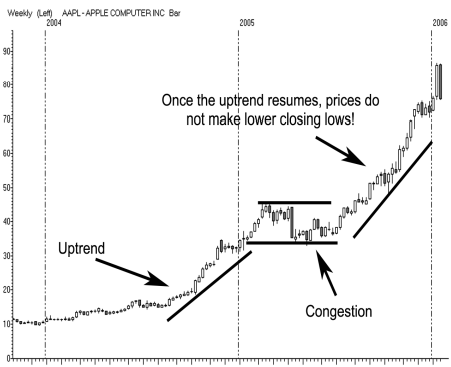
After
that, as you can see, it did move higher at the start of 2006; but the tweezer
top formation (equal and opposite) contained the rally, and prices ended back
where they started.
The Candlestick and Pivot Point Trading Triggers : Chapter 2. Determining Market Condition : Tag: Candlestick Trading, Stock Markets, Pivot Point : trend phase, False breakouts and reversals, bullish chart patterns - Presence of Catch