Best Candlestick Pattern - J-Hook Pattern
j hook pattern trading, j hook stock pattern, j hook chart pattern, j hook candlestick pattern
Course: [ How To make High Profit In Candlestick Patterns : Chapter 5. Candlestick Signals and Patterns ]
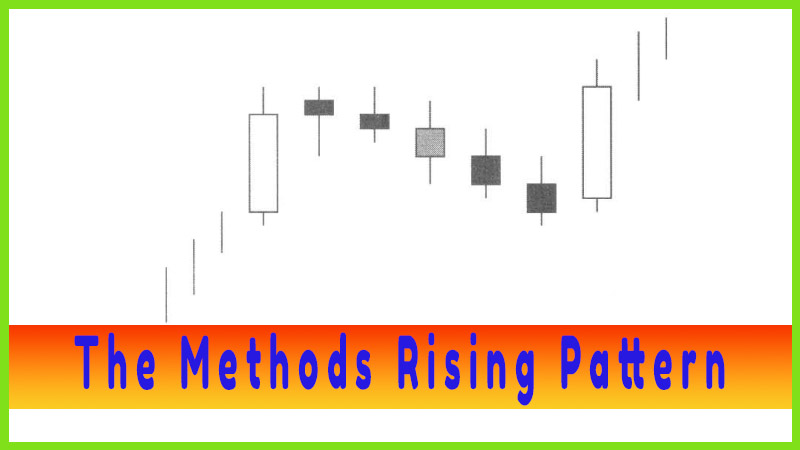
A J-hook pattern (J-hook) is a variation of a wave 1 — 2 — 3 patterns. It becomes an easy pattern to identify with the use of candlestick signals. The problem most investors have is understanding when to sell after a price has made a strong move.
J-Hook Pattern
A J-hook
pattern (J-hook) is a variation of a wave 1 — 2 — 3 patterns. It becomes an
easy pattern to identify with the use of candlestick signals. The problem most
investors have is understanding when to sell after a price has made a strong
move. The J-hook pattern demonstrates some easily identifiable attributes.
First, it starts with a strong uptrend that usually produces “stronger than
normal” returns in a very short period of time. This strong up move is
significant enough to create the normal wave pattern. A reversal caused by
profit taking, followed by a declining trajectory of the pullback, then the
continuation of the uptrend. The J-hook pattern is the description of the
pullback that starts to round out at a bottom and starts moving back up, thus
forming a ‘hook.’
This
pattern provides the candlestick investor with some very simple profitable
applications. Tire first uptrend will usually show clear candlestick ‘sell’
signals when it comes to an end. The top may be formed with the stochastics in
the overbought, or very close to the overbought area. Because of the strong
initial uptrend, the first evidence of ‘sell’ signals should be acknowledged.
Even if it is suspected that the uptrend could be forming a J-hook pattern, why
risk remaining in the trade? When a sell signal becomes evident take your
profits.
What
criteria makes a candlestick investor suspect a J-hook pattern will form? The
analysis of the market trends in general should provide that information. For
example, if a stock price had a strong run up while the market indexes had a
steady uptrend, and the market indexes do not appear to be ready for a
significant pullback, then a strong stock move could warrant some profit taking
before the next move up. The benefit of being able to identify candlestick
signals is being prepared for some candlestick ‘buy’ signals after a few days
of pullback. These signals would also alter the trajectory of the stochastics
that will be pulling back.
Witnessing
Doji, Hammers, Inverted Hammers or Bullish Harami after a few days of a
pullback becomes an alert that the selling is starting to wane. If the
stochastics are flattening out during that same timeframe, then a set-up for a
J-hook pattern is taking place. Taking profits when the first sell signals
occur in the initial uptrend eliminates the downside risk. Those candlesticks
‘sell’ signals indicate that it is time to get out of the trade. Even though
the strength of the initial move would warrant suspecting a J-hook pattern to
form, there is no guarantee that the pullback could not retrace 20%, 40%, 60%,
or even greater of the initial move up.
This
creates a trading strategy that allows an investor to utilize the common sense
built into the candlestick signals. When it is time to get out, get out! If
after four days, small candlestick buy signals start forming, there is nothing
wrong with buying back into the position. The second entry of this trade now
has some targets that can be clearly defined. The first target should be the
test of the recent high. Although it may not be a huge percentage return moving
to that level, at least the probabilities indicate that it should be
profitable.
The
benefit of candlestick signals once again can be applied if and when that
recent high is tested. Witnessing another sell signal, as the price approaches
the recent high trading level, would be a clear indication that the recent high
was going to act as resistance. This would induce taking quick profits and
getting back out of the trade. On the other hand, if strong signals are seen as
the recent high is breached, that would be a clear indication the high was not
going to act as a resistance level. A new leg of the trend may be in progress.
Note the
J-hook pattern in Fig. 6-1, the Loews Corporation chart. Once the trend started
up, the pattern formed when the price pulled back for a few days.
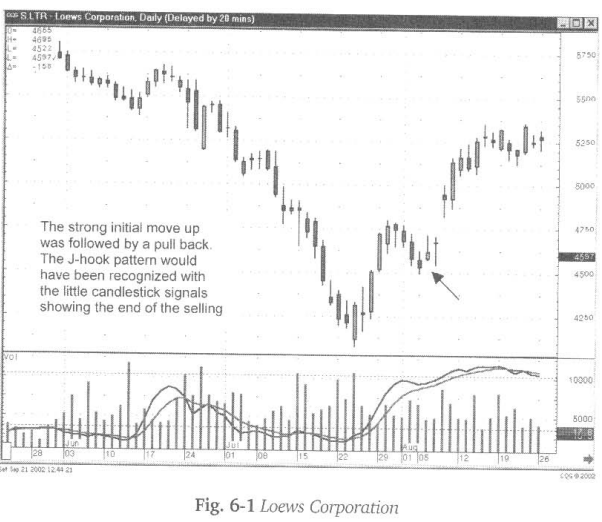
However,
the stochastics never reached the oversold area and they came down only part
way before hooking back up. The signals indicated buying before it pulled back
too much, showing the buyers were going to test the high of the previous week.
The gap above the recent high indicated that the buyers were very anxious to
see prices go to much higher prices. Recognizing this pattern and the elements
that form it allows an investor to move decisively at the right points of a
trend. Being prepared for the pattern and knowing what signals to look for,
creates opportunities to participate in a profitable trend while greatly
reducing risk.
Where
will the pullback move to? Sometimes that is obvious, sometimes it is not. Yet
there are indicators that can at least provide a target for a J-hook pullback.
In the
example of the Diamond Offshore Drilling Inc. chart, Fig. 6-2, the 50-day
moving average becomes the obvious support level. Although the stochastics have
not moved back down to the oversold condition, it becomes apparent with the
Bullish Engulfing pattern, followed a few days later by a Doji and a gap-up
day, the potential of a J-hook pattern is starting.
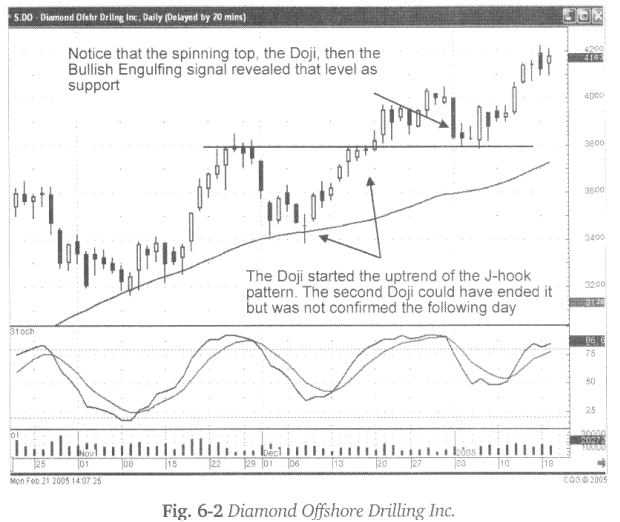
Some
patterns become very easy to recognize and things do not have to be made
complicated. “Buy” signals, occurring at a major technical support level, even
though the stochastics are only part way down toward the oversold area, should
be recognized for their potential. Buying in the $35 area should be done with
the anticipation that the price could reasonably test the recent high at the
$38 area. Once again, the benefit of candlestick signals is being able to determine
whether the $38 level will become a resistance level or not. The Doji could
have been the resistance signal had the prices opened lower the following day.
Seeing
prices move higher the following day would have been an indication that there
was no selling at the recent high level. More upside from that point now became
a good probability
As a
side-note, the uptrend, at $40 a share, indicated the potential pullback, but
notice how the recent resistance level, the $38 area now becomes the support
level. The Spinning Top, the Doji, and then the Bullish Engulfing signal
provided the visual information that the $38 area was now acting as support.
Fig.6-3,
The Valero Energy Corp. Inc. chart is an illustration of a potential J- hook
pattern move. As the candlestick buy signals appear, the Hammer, followed a few
days by later the Piercing signal, and the stochastics start curling up, the
recent high becomes the first potential target.
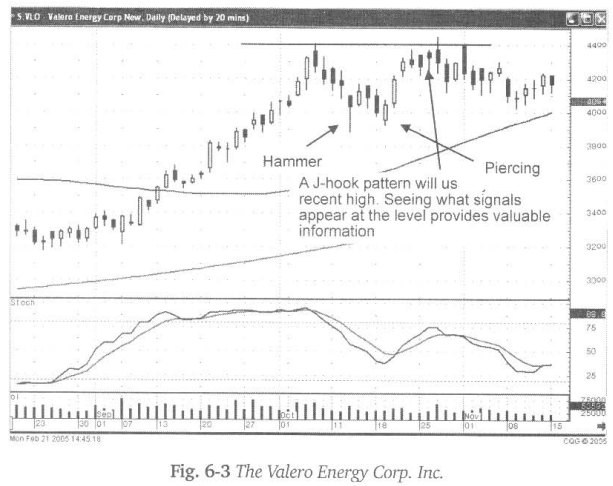
In this
case, the candlestick sell signals make it apparent that the $44 area is not
going to be broken. The Spinning Tops, Hanging Man, and Dark Cloud signals, as
stochastics are starting back down, revealed that the buyers have run out of
strength. The evidence of buying strength would have been revealed with more
white candle bodies. The presence of the black candle signals becomes our message
that the buying strength is waning at the $44 area.
Fig. 6-4,
The Excel Maritime Carrier chart provides an opportunity to take advantage of a
J-hook pattern. Whether an investor was involved in the initial move or not,
the fact that a potential J-hook pattern could be forming can produce
calculated profits in the next move. Buying into this stock at about the $12.50
area still has a viable probability that the $15 area will be tested once
again.
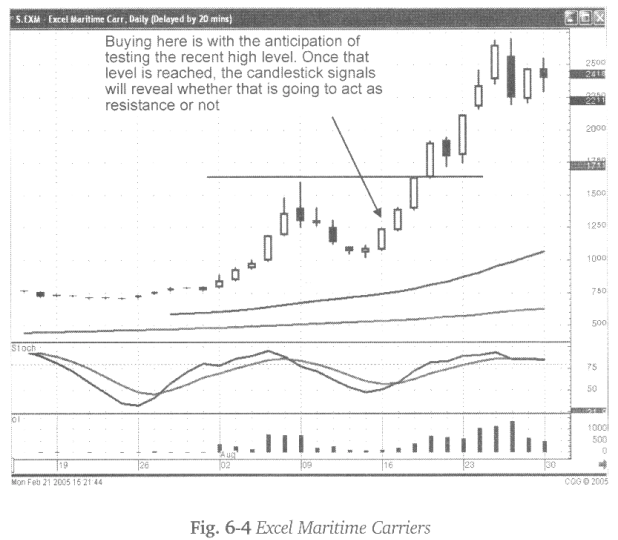
A $2.00
to $2.50 move is still worth the attempt. If prices gap back up to the $15 area
and candlesticks sell signals started appearing, then it would be a logical
deduction that this move was not heading to new highs. However, a $2.00 move on
a $12.50 price is still a reasonable percentage return. But, as illustrated in
the EXM chart, the resistance level at the $15 area was breached with a large
bullish candle. This should reveal immediately that new high levels were going
to be attempted. This makes participating in a J-hook pattern very rewarding.
Somewhat rewarding, even if it fails at the recent highs, with additional explosive
return potential if the recent high is breached.
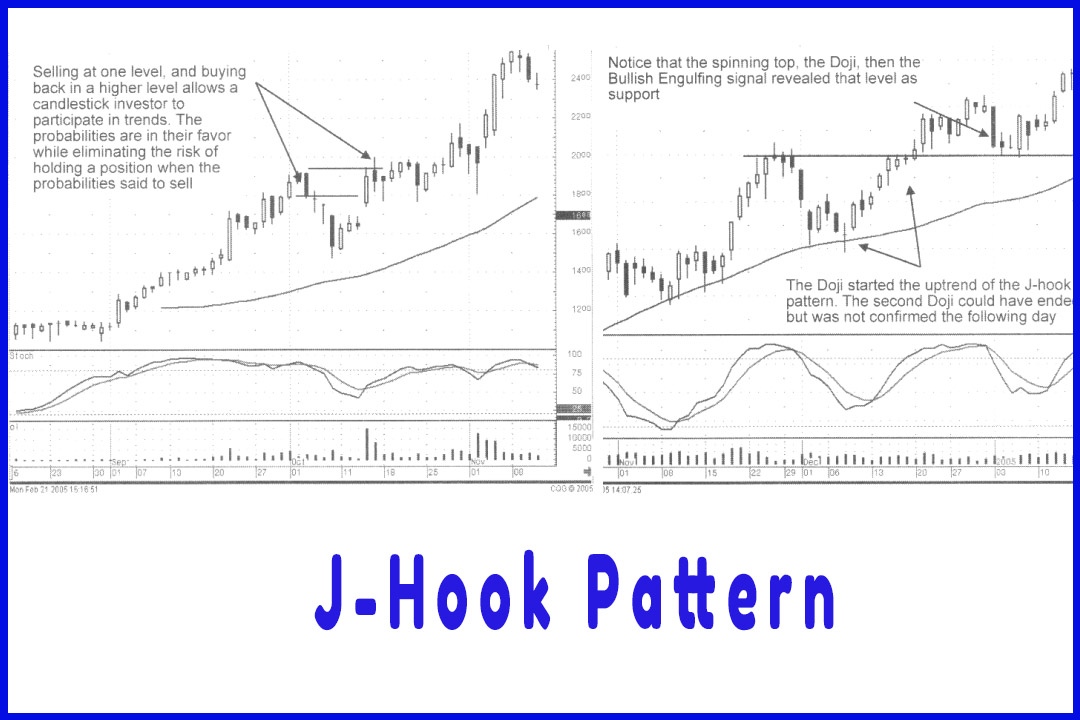
Does the
J-hook pattern always allow an investor to sell at one level and buy back in
lower? Not always! However, keep in mind that the point of investing is to
maintain the practice of maximizing your profits for your account, not
necessarily maximizing profits for each individual trade.
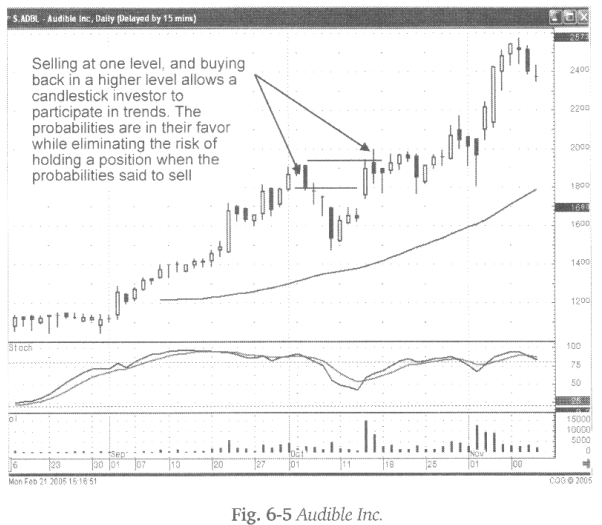
As
illustrated in Fig.6-5, the Audible Inc. chart, the high-probability trade was
taking profits on the confirmed selling after the Bearish Engulfing signal.
Buying back, upon the formation of the J-hook pattern being established, may
have been done at a higher price. Candlestick analysis does not attempt to buy
at the absolute lowest point and sell at the absolute highest point.
Candlestick analysis illustrates when it is time to buy and when it is time to
sell. That definitely eliminates the possibility, most of the time, of buying
in at the absolute bottom. The ‘buy’ signals indicate a high-probability ‘time
to buy5 in a trend. The time to sell does not come at the absolute top. The
time to sell comes in the top “range”.
Understanding
the mechartics of a J-hook pattern allows an investor to take profits after the
initial move. This has the investor out of a trend that “potentially” could pull
back too much lower levels. When the signals indicate the pullback is over,
establishing a new position has the investor in a trend that should be moving
in the anticipated direction. Not participating in all of a move that a trend
offers reduces investor risk dramatically. Selling at one level, when the
candlestick signals indicate that is time to sell and buying back when the
signals/pattern tells the investor it is time to buy, even if at a higher
price, is the cost of insuring that your investment funds are always participating
in high probability trades.
Why own
stock if the signals show a high-probability that it could be heading back
down? Sell it! If a J-hook pattern forms, buy it back.
The
benefit of the candlestick signals is that they reveal when a pullback is not
occurring with great enthusiasm. When an uptrend moved with inordinate force, a
pullback with greater magnitude can be expected. Viewing small candlestick
“buy” signals, a few days after a pullback has occurred, at least provides the
inkling that the pullback may just be profit taking. As the downward trajectory
of the pullback starts flattening out, watch for more buy signals. When the
trend starts moving up, a new position can be established.
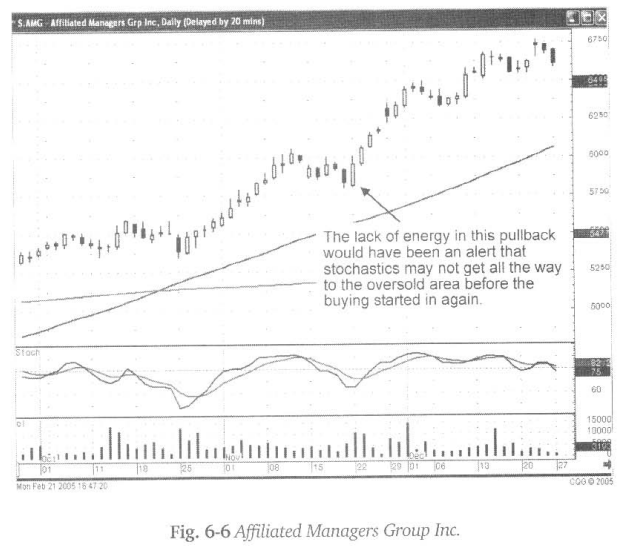
Fig. 6-6
(following page), The Affiliated Managers Group Inc. chart demonstrated a good
strong move to the upside, followed by a week of trading that lacked
decisiveness. The Bullish Engulfing signal, correlating with the stochastics
curling back up, would have been a signal that the sellers were getting out of
the way. The strength of the candle following the Bullish Engulfing signal
would have revealed that the uptrend should now be continuing.
Tine
J-hook pattern should be analyzed in conjunction with what the markets are
doing in general. The market indexes can be analyzed by themselves. After a
strong rally, a profit-taking period is to be expected. Having the benefit of
the candlestick signals allows an investor to better decipher whether the rally
has ended. A full-scale reversal may have occurred. However, seeing some candlestick
buy signals after a few days of pullback allows the candlestick investor to
formulate a strategy. That strategy should involve deciding whether to short
heavily in that market or be prepared to re-establish long positions.
Once
candlestick buy signals start appearing in a market index chart, giving the
indication that a J-hook pattern could appear, prepares the investor mentally
to move one way or the other. If short positions were established at the first
sell signals in the trend, being prepared for the covering of those positions
can be better executed when a J-hook pattern formation is anticipated.
Individual
stock positions have the additional benefit of the market trend itself in
evaluating the potential J-hook pattern. If during the market uptrend, a stock
price has moved up with greater magnitude than the market trend in general,
that becomes the first alert. Simply, that stock trend is inordinately strong.
A pullback occurring in that stock, when the market trend appears to be
continuing, also gives rise to watching for a J-hook pattern to occur.
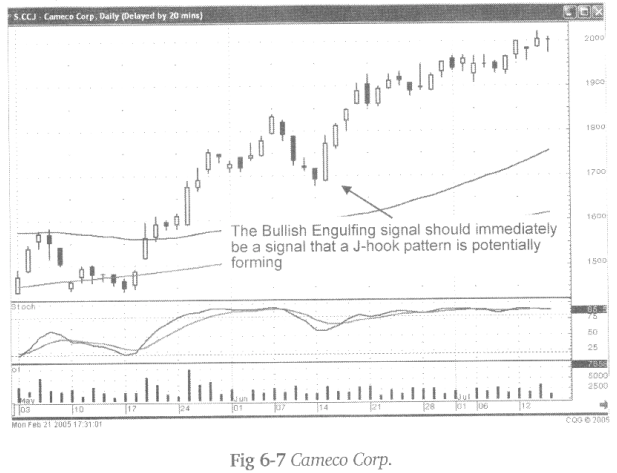
Fig. 6-7
The Cameco Corp, chart illustrates a J-hook pattern that is confirmed with a
Bullish Engulfing signal. The continued buying, the following day, provides a good
indication that they are going to test the recent high.
This may
not result in a very large percentage return if the sell signals appeared at
the recent high. However, the probabilities could be better justified if the
market trend in general was moving in a slow bullish fashion. It makes
entering a trade more appealing when market conditions do not show any severe
selling and a strong moving stock is about to break out to new levels on a
J-hook pattern.
This may
seem very elementary, but this allows the candlestick analyst to make some very
simple, quick evaluations. The whole point of candlestick investing is exactly
that; making high-probability trade evaluations in a very short timeframe,
within minutes every afternoon.
The
J-hook pattern should be remembered as a high profit trade potential. As
discussed during the chart illustrations, a J-hook pattern is going to occur
after witnessing a very strong move in price. Whether that price is in the
indexes themselves or in individual stocks, a strong move to the upside is
usually going to be followed by some profit taking. Being able to analyze
whether that pullback is profit taking or a true reversal is easily analyzed
when applying the candlestick signals.
The
J-hook pattern is more often going to be found in market conditions where the
trend is moving steadily in one direction. The stronger than normal percentage
move is the first major criteria for a J-hook pattern to occur. Once a
candlestick sell signal appears, after an extended strong move, the candlestick
investor wants to watch for candlestick ‘buy’ signals to begin appearing. The
signals do not necessarily need to be big, strong signals. Small volatility
days of Doji, Hammers, and Inverted Hammers or Bullish Engulfing signals
provide the indication that the selling is losing strength. As they occur, the
stochastics should start showing a flattening of the downward trajectory.
Upon
seeing the downward trajectory in the price flattening out, an investor can
now start watching for the next candlestick buy signal that starts moving
price in an upward direction. When that occurs, establishing a position is
based upon the price testing the recent high, prior to the pullback. At that
level, a decision can be made. If candlestick sell signals start appearing near
the recent high, it becomes obvious that the recent high is going to act as
resistance. The trade can be closed out immediately. On the other hand, if the
candles indicate buying, going through the recent high, it becomes a clear
indication that the recent high will not act as resistance. The move into a
higher ground can now be expected. This move will usually produce a move up
with the same magnitude as the first move up before the J-hook pullback.
The
likelihood of a J-hook pattern is a function of the market conditions in
general. The longer and more steady an uptrend in the general markets, the more
likely J-hook patterns will become present.
How To make High Profit In Candlestick Patterns : Chapter 5. Candlestick Signals and Patterns : Tag: Candlestick Pattern Trading, Forex : j hook pattern trading, j hook stock pattern, j hook chart pattern, j hook candlestick pattern - Best Candlestick Pattern - J-Hook Pattern