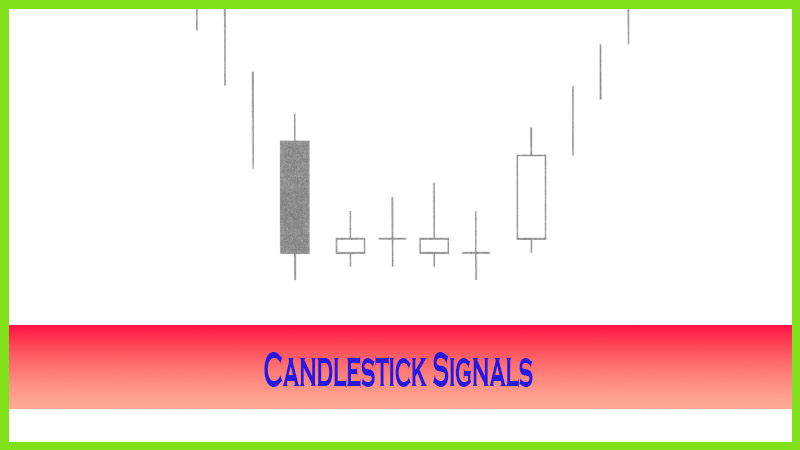
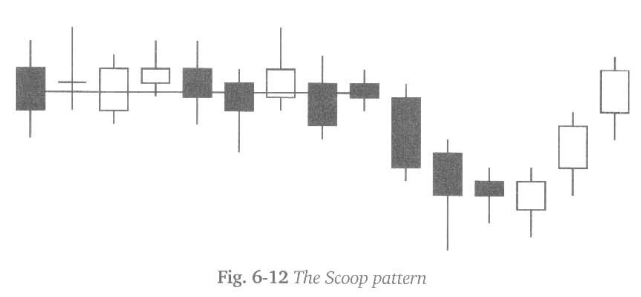
The Scoop Pattern
Single candlestick patterns, Types of candlesticks, Powerful candlestick patterns, Types of candlesticks, Candlestick chart analysis, Bearish candlestick patterns
Course: [ How To make High Profit In Candlestick Patterns : Chapter 5. Candlestick Signals and Patterns ]
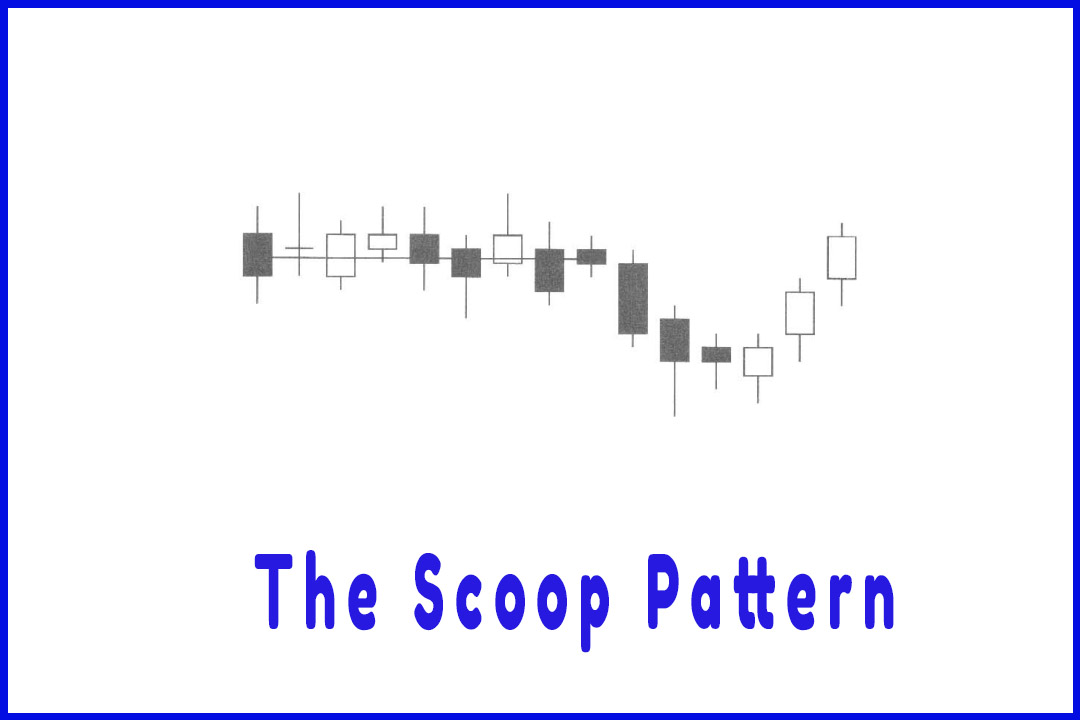
The Scoop pattern works effectively and can be easily recognized. The candlestick signals allow an investor to exploit it properly. The explanation of how and why it works is subjective. The pattern is formed after a lengthy period of flat trading, known as the ‘handle.’ The handle is usually comprised of small, indecisive trading days.
The Scoop Pattern
The Scoop
pattern works effectively and can be easily recognized. The candlestick signals
allow an investor to exploit it properly. The explanation of how and why it
works is subjective. The pattern is formed after a lengthy period of flat
trading, known as the ‘handle.’ The handle is usually comprised of small,
indecisive trading days. After a recognized flat trading timeframe, the price
starts to back down. The term “recognized” is visually determining a flat trading
area. That flat trading will usually maintain for a longer length of time than
what is usually seen in the price movement of that trading entity. It becomes
obviously lengthy, to the point where it becomes boring to be in that position.
It may be
the boredom that finally makes the price move down. Investors get tired of
waiting for it to do something. However, after a few days the small buying
signals start showing up. The price starts moving back up toward the flat area
creating the scoop. An inordinate percentage of the time when the price comes
back up to the flat trading area, the trend continues in a strong upward direction.
This may be the result of everybody that was bored with the trading sees it is
finally moving and start adding to their positions again.
The
visual recognition of the handle, being followed by the pullback should be the
‘alert.’ Upon seeing new buying, after a few days a pullback is a set up for a
low risk trade. Buying near the bottom of the scoop allows the stop-loss area
to be at the low of the scoop. The first test from there should be the flat
trading area. A breakout through that area indicates that a good trend is in
the making.
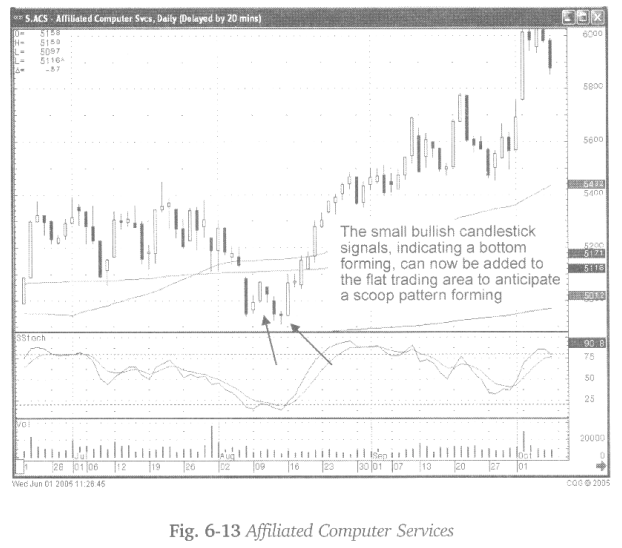
Fig.
6-13, The Affiliated Computer Services chart reveals a flat trading period,
followed by the price breaking down. After just a few days of pullback, bullish
candlestick signals start to appear. Being able to visualize the handle,
followed by a pullback, then witnessing candlestick buy signals should alert
the candlestick investor to the potential of a scoop pattern forming.
Additional
technical indicators such as moving averages can help anticipate a support
level. The trading support at that level after a relatively long flat trading
area adds more visual credibility to the scoop pattern development.
As seen
in Fig. 6-14, the WCI Communications chart, the 5O-day moving average is a
logical support level.
“Half of being smart is knowing what you’re dumb at.”
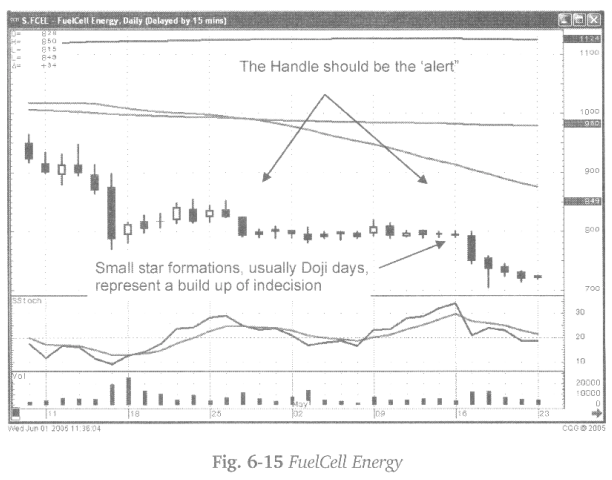
What is
the key element forewarning a Scoop pattern? As can be seen in Fig. 6- 15, the
FuelCell Energy chart, the long flat trading area, the handle, followed by a
pullback has the makings for a Scoop pattern. Notice how the force of the
selling is depicted by the smaller candlestick bothes until a little star
formation appears. That should suggest watching for new buying.
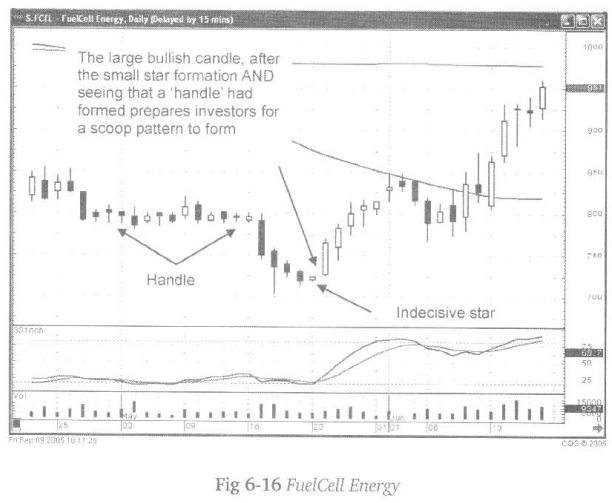
The
trajectory of the downtrend, created by small trading days, is an alert to
expect bottoming action. Once buying is witnessed at this level anticipate the
first price test to be back at the ‘handle’ level. The appearance of a large
bullish candle after the Star/Doji provides a better visual confirmation that a
Scoop Pattern is about to form. The analysis from that point is anticipating a
test of the recent flat trading area. A successful scoop pattern will be the
stimulus for a long and steady uptrend.
The
uptrend can continue for an extensive period of time, keeping the stochastics
waffling in the overbought area. It is not unusual to see the uptrend coming
out of the scoop pattern last for four to six weeks. This makes identifying the
scoop pattern in its early formation an extremely profitable trade.
Once the
price has tested and then breached the previous flat trading level, upside
targets can be projected. FuelCell Energy hit its first target, the 50- day
moving average. Once an uptrend comes through the handle area, the stochastics
become less of an influence.
The Scoop
pattern, the same as the Fry-Pan Bottom pattern, is going to be more effective
when the stochastics are in the overbought area. Also, developing a scan for a
scoop pattern is going to be difficult. The only recognition of the pattern
comes from reviewing the chart once a buy signal occurs at the end of a
pullback. Recognizing the flat trading period prior to the pullback prepares
the investor for a high profit trade.
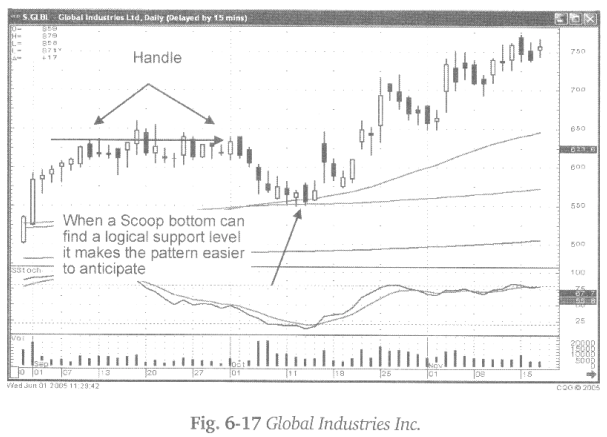
As seen
in Fig. 6-17, the Global Industries, Inc. chart, the buy signals forming in an
oversold condition was the first alert. Those signals forming right on the
moving averages added more credibility to the trade. Was this a worthwhile
trade? That becomes an easier evaluation when understanding that a Scoop
pattern possibility should at least test the ‘handle’ area. If the handle area
was breached, then the likelihood of a strong trend after that was good.
The Scoop
pattern can produce big profits. Buying at the bottom of the potential scoop
makes for a small stop-loss set-up. The first test is the handle. The upside
potential if breaching the handle will provide good profits.
How To make High Profit In Candlestick Patterns : Chapter 5. Candlestick Signals and Patterns : Tag: Candlestick Pattern Trading, Forex : Single candlestick patterns, Types of candlesticks, Powerful candlestick patterns, Types of candlesticks, Candlestick chart analysis, Bearish candlestick patterns - The Scoop Pattern