The Fry-Pan Bottom
curving pattern, Fry-Pan Bottom formation, Morning Star signal, investor sentiment
Course: [ How To make High Profit In Candlestick Patterns : Chapter 5. Candlestick Signals and Patterns ]
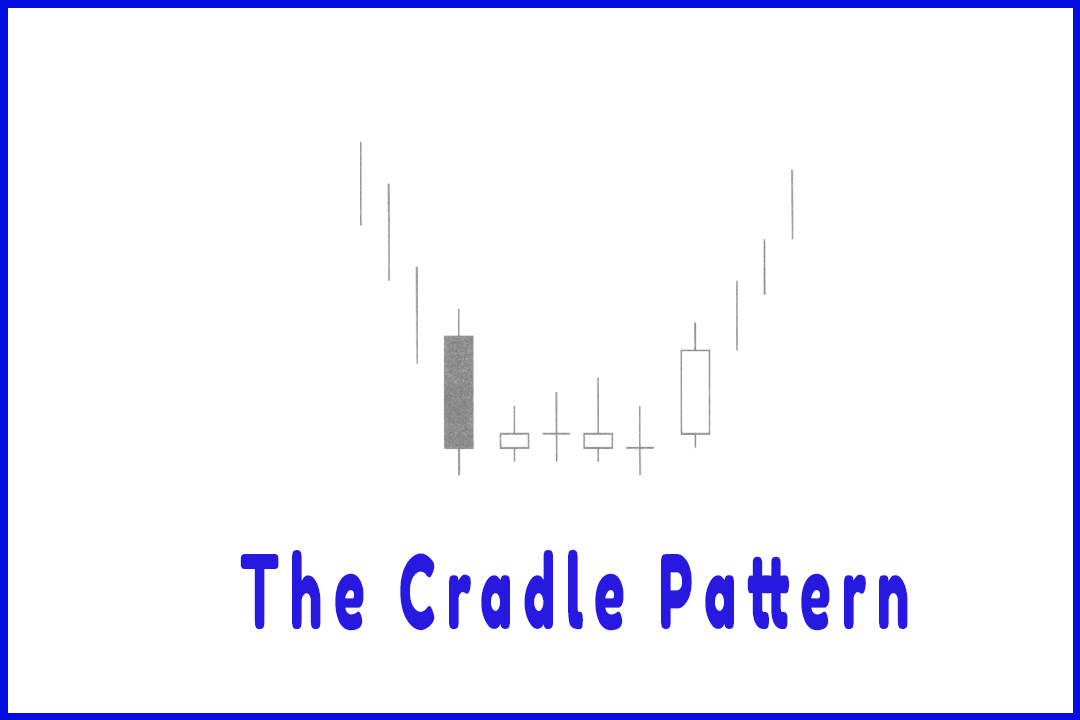
The Fry-Pan Bottom pattern is aptly named. It does not take a high degree of technical analysis to figure out the investor sentiment that forms a Fry-Pan Bottom. This pattern gets its name because it looks like a Fry-pan bottom.
The Fry-Pan Bottom
The
Fry-Pan Bottom pattern is aptly named. It does not take a high degree of
technical analysis to figure out the investor sentiment that forms a Fry-Pan
Bottom. This pattern gets its name because it looks like a Fry-pan bottom. The
pattern is a slow curving pattern to the downside, flattening out at the
bottom, and then slowly coming up out of the other side of the pattern. The
analysis for the investor sentiment is very easy to understand. Initially after
a downtrend, the selling sentiment starts to wane, making the trajectory of the
downtrend a slow inactive bottom trading pattern.
After a
lengthy period of time, the sentiment almost becomes neutral, forming a flat
area. This lack of interest eventually starts to incorporate a very slow change
of investor sentiment to the plus side. The new positive outlook shows the same
lack of enthusiasm on the buy side as it did on the sell side. However, the
difference now becomes that the selling interest has disappeared. The buying
interest is slowly coming back into the price. This pattern, unlike other
patterns, utilizes the condition of the stochastics in an opposite manner. It
is when stochastics are approaching the overbought conditions that investor
sentiment can be gauged.
The alert
for this pattern is activated when stochastics get up in the overbought area.
The price now shows that confidence has built back up into the price in the
form of a large bullish candle or a gap up coming out of the positive side of
the Fry-Pan Bottom pattern. This buying indicates that investor sentiment has
now produced confidence for being back in the position. A gap up becomes a
signal to buy even though the stochastics are approaching or are in the
overbought area. That enthusiasm, coming out of a long bottoming action, will
usually create a strong buy trend.
Notice
the long four-month period of time in Fig. 6-8, the Isonics Corp, chart that
the investor confidence shifted. The telling factor for the potential breakout
was the subtle Fry-Pan Bottom formation. A couple of simple elements can be
added to Fry-Pan Bottom analysis. The first being the very bottom of the
Fry-Pan is approximately one-half the distance from the time the Fry-Pan Bottom
started until it will break out. This is not anything that is set in stone. A
simple observation is that the very bottom occurs in the middle of the Fry-Pan Bottom.
Having this knowledge allows the investor to estimate when the breakout might
occur.
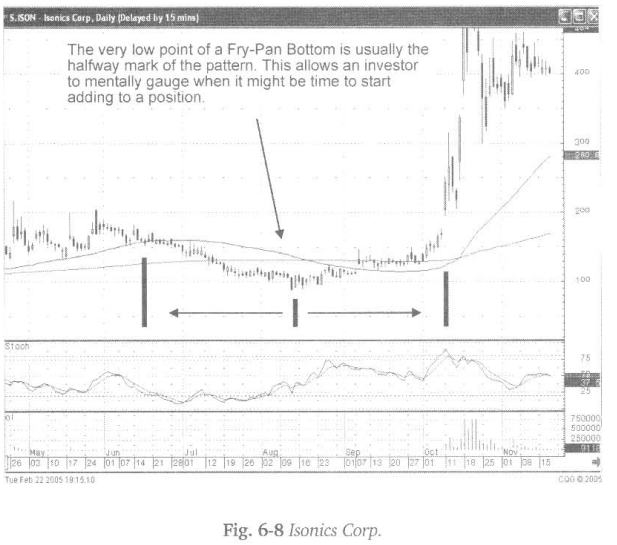
This
calculation does not need to be exact. Visually the buying can be seen as the
confidence starts building back up. When the buying level starts approaching
the same level as when the pattern started to develop, that is when to start taking
action. In early October the Isonics Corp, chart started revealing some bullish
candlestick formations. The volume started expanding. This now becomes evidence
that the buyer’s confidence could create a breakout situation.
The
confirmation of the breakout, after the Fry-Pan Bottom, comes as a large
bullish candle or a gap up. This will usually occur near the high point of the
beginning of the Fry-Pan Bottom formation. Whether you decided to buy this
stock in the first few days of October or after the breakout occurred, does not
really matter. After the extended period of time, it takes to form this
pattern, buyer confidence has built up a lot of steam. The percentage move out
of the pattern should be very large.
These
patterns do not occur very often. Fortunately, when they do occur, they can be
found and then followed without too much difficulty. That allows an investor to
become well-prepared for taking advantage of the potential results.
Fig. 6-9,
The W. R. Grace & Co. chart illustrates a very slow decline, followed by a
‘dimple’ at the very bottom of the pattern. Once it was interpreted that the
buy signal was not creating the immediate buying one would hope for, the slow
build-up of confidence could be seen. The Fry-Pan Bottom pattern creates a
different analysis versus a stock price that is starting to get to the overbought
area, then seeing some exuberant buying. The breakout occurring after a Fry-Pan
Bottom formation reveals a completely different scenario.
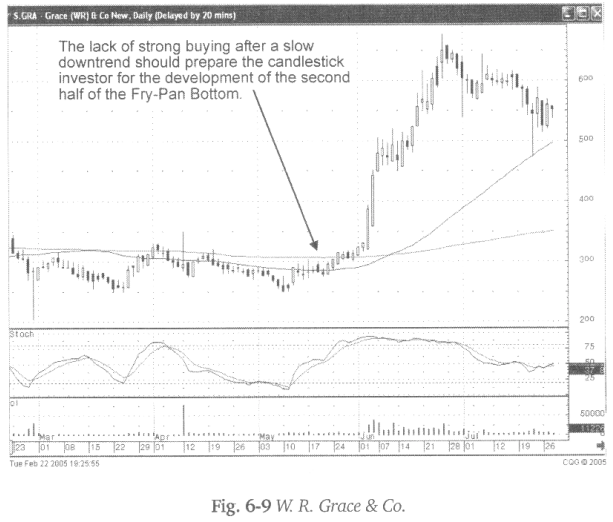
Training
the eye to recognize how a pattern is setting up creates the opportunity to
participate in a big profit move. The slow downtrend, followed by a slow
uptrend, will have different results. When the trading gets close to completing
the Fry-Pan Bottom formation, funds can start to be committed.
Because
of the length of time the pattern takes to develop, they should not be a
primary source for a trading strategy. However, this pattern can be used when
the timing becomes apparent. Although they do not occur with great frequency
the percent return produced makes the pattern well worth being able to recognize
the formation.
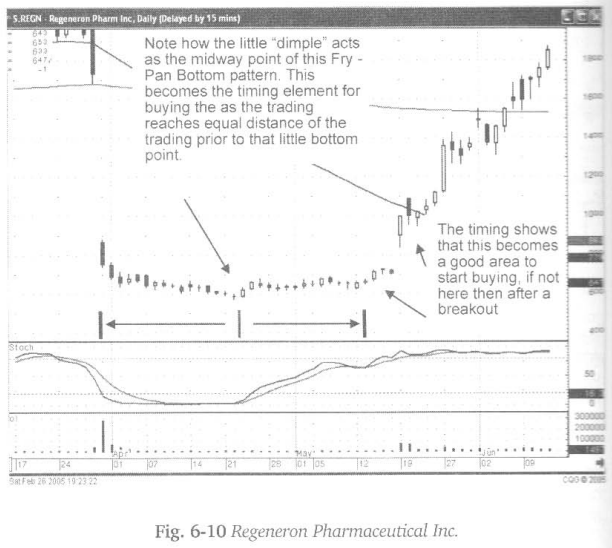
Fig.6-10,
The Regeneron Pharmaceutical, Inc. chart demonstrates analysis of a Fry-Pan
Bottom pattern correctly. Whatever bad news generated the big sell-off in late
March, the investor sentiment remained negative going into the latter part of
April. Although the sentiment was not severely negative, it still was negative.
A small bullish signal occurring approximately April 24 was the first sign of
negative sentiment reversing.
This
could have caused buying of that position. However, the lack of follow- through
for the next few days would have revealed that no new extensive buying was
coming into the stock. That may have produced a decision to move money
elsewhere. The indecisive period continued, with very slow upward movement.
That is what visually revealed a Fry-Pan Bottom formation.
As we
have learned, a basic rule of a Fry-Pan Bottom is that the bottom usually
occurs midway from the time the pattern starts to the time that a breakout
occurs. The little “dimple” occurring approximately April 24 now becomes a
timing factor. As the formation approaches the same timeframe after that
dimple, it becomes time to look for a potential breakout. The second week of
May becomes a good time to start adding to this position. The breakout, on big
volume in mid-May, is definitely the time to be buying.
“Every man who observes vigilantly and resolves steadfastly
grows unconsciously into genius.”
Although
the breakout occurs with the stochastics in the overbought area, the breakout
clearly illustrates that investor sentiment has grown. Everyone is confident,
once again, to be in the stock.
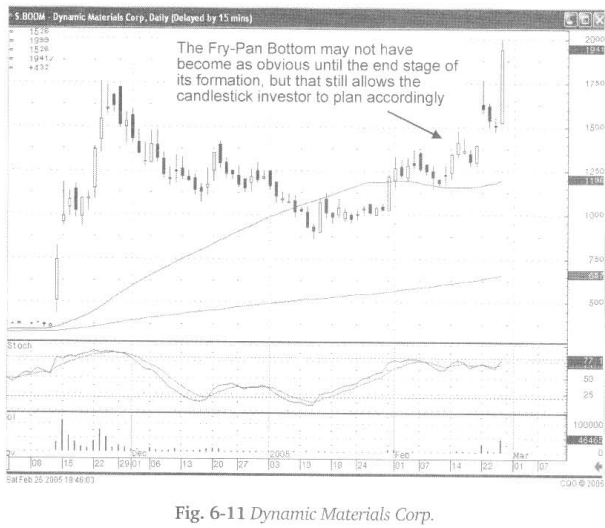
Fig. 6-11
(following page), The Dynamic Materials Corp, chart may not clearly reveal a
Fry-Pan Bottom until the latter stages of the formation. Buying in the second
week of January, upon the formation of a Morning Star signal, or buying in mid-
February after the three indecisive days formed right at the 50- day moving
average pullback, may have been based on other factors. As the chart pattern
moves into late February, the gap up has a different connotation to it, after
being able to view the whole pattern, starting from the peak of late November.
What
might have been analyzed as a Shooting Star at the top of a trading range in
normal circumstances now should be analyzed as the potential breakout from a
Fry-Pan bottom formation. This analysis, along with the stochastics not quite
being in the overbought area, would provide more reason to hold the position,
expecting more buying.
The
Fry-Pan Bottom formation is not a difficult formation to analyze. It should be
kept in your mental arsenal of potentially large trade results. Identifying its
formation changes the basic rules of how to use stochastics with candlestick
signals. Where most buy signals work effectively, when stochastics are in the
oversold area, that rule does not necessarily apply in a Fry-Pan Bottom formation.
The slow buildup of confidence, witnessed in the slow uptrend, should be
considered like the coiling of a spring. As it gets close to the same level as
the beginning of the pattern, the potential for that spring’s energy to let
loose becomes greater.
If a
purchase of a position was not made in the latter stages of the pattern, the
majority of the move can still be exploited once the breakout occurs.
“A man has no ears for that to which experience has given him no
access.”
How To make High Profit In Candlestick Patterns : Chapter 5. Candlestick Signals and Patterns : Tag: Candlestick Pattern Trading, Forex : curving pattern, Fry-Pan Bottom formation, Morning Star signal, investor sentiment - The Fry-Pan Bottom