Breakout Trading Strategy
Single candlestick patterns, Types of candlesticks, Powerful candlestick patterns, Types of candlesticks, Candlestick chart analysis, Bearish candlestick patterns, Breakout Trading
Course: [ How To make High Profit In Candlestick Patterns : Chapter 5. Candlestick Signals and Patterns ]
One of the most powerful investment techniques is to exploit the explosive nature of a breakout. The term “breakout” should be relatively self- explanatory. It signifies a price move that is dramatically out of the ordinary for the normal trading pattern of a trading entity.
One of
the most powerful investment techniques is to exploit the explosive nature of a
breakout. The term “breakout” should be relatively self- explanatory. It
signifies a price move that is dramatically out of the ordinary for the normal
trading pattern of a trading entity. How do candlestick signals and formations
benefit in breakout trading? Being able to evaluate what the continuing move
will be after a significant price move becomes very important. Is the price
move a one-day fluke? Did severe short covering affect the price? Will the
trend continue after a significant percentage price move? These are all questions
that can be answered by simple evaluation of the candlestick formation at the
end of a trading day.
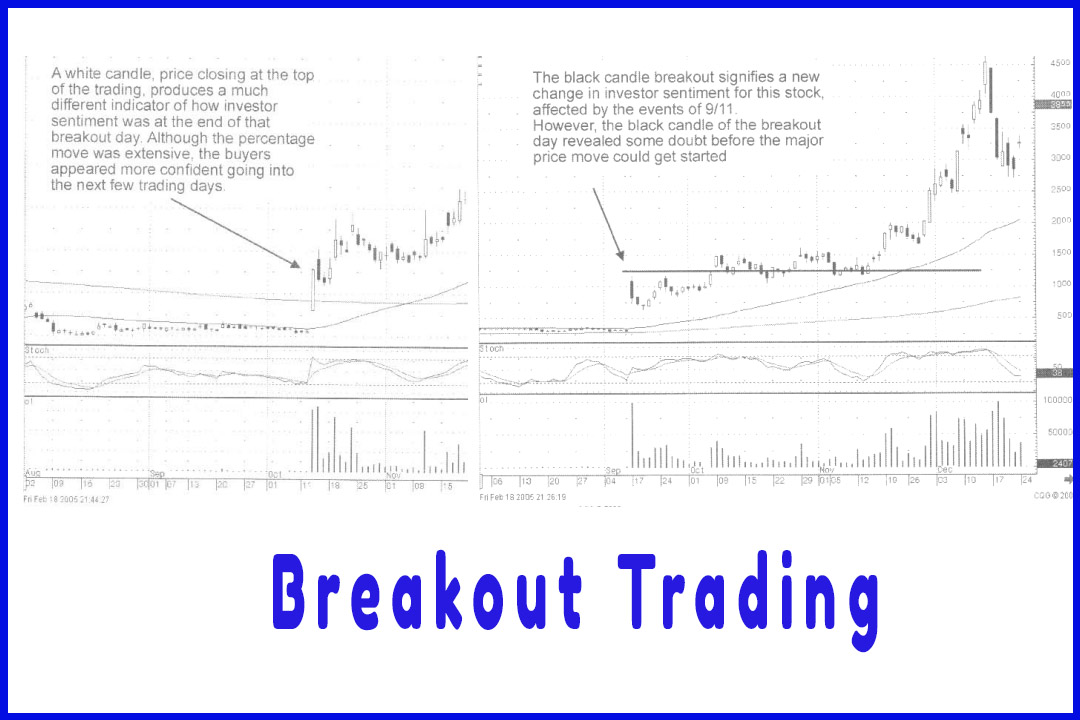
There is
a significant difference of a breakout where the price starts low and ends near
the top of the trading range. This creates a large white candle. A price that
opens up significantly higher and closes at the lower end of the trading range
is a completely different scenario. Although the price may be dramatically up
for the day, the type of candlestick formation produced on that day provides
significant investment information.
Fig.
6-18, The INVN chart clearly illustrates a change in investor sentiment when
an outside event affects a stock price. Notice how the stock jumped from $2.50
a share to $8.00 a share during the 9/11 attacks on the World Trade Center. The
large volume breakout, although impressive, did not have any major significant
price move for two months after the breakout. The fact that the breakout day
opened at around $11 a share and closed near $8.00 affected the price trend.
The buying started three days later after a small Morning Star signal formed
but overall the price of this stock was almost the same as where it opened on
the breakout day in mid-November
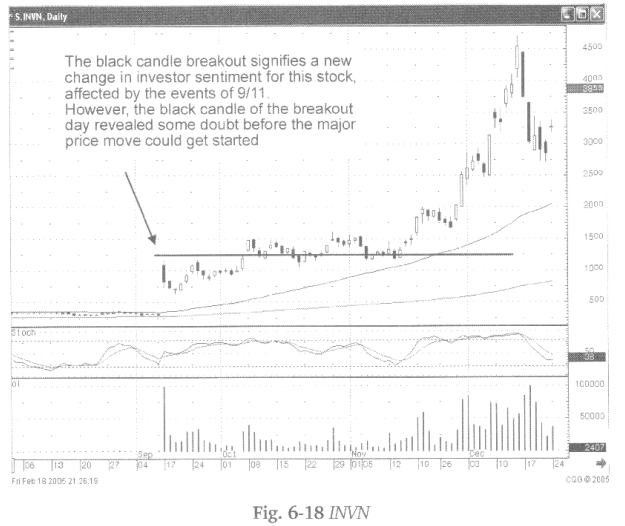
As seen,
the price started moving significantly after the breakout. But the large black
candle on the breakout day indicated there was still some doubt in investor sentiment
at the end of the day. This was reflected in the stock price for a few months.
The fact
that a breakout has occurred in the first place reveals something. That
something may be a new dynamic coming into the stock price. That dynamic may
have been created by internal improvements of a company. The new investor
sentiment may also be caused by an external event that changes the outlook for
a company’s fundamental potential or a commodity supply or demand potential.
Whatever the cause for the breakout, an investor wants to be able to analyze
whether a dramatic price move is a one time shot or if it’s the beginning of a
huge price jump. Candlestick analysis greatly enhances the ability to evaluate
the potential move.
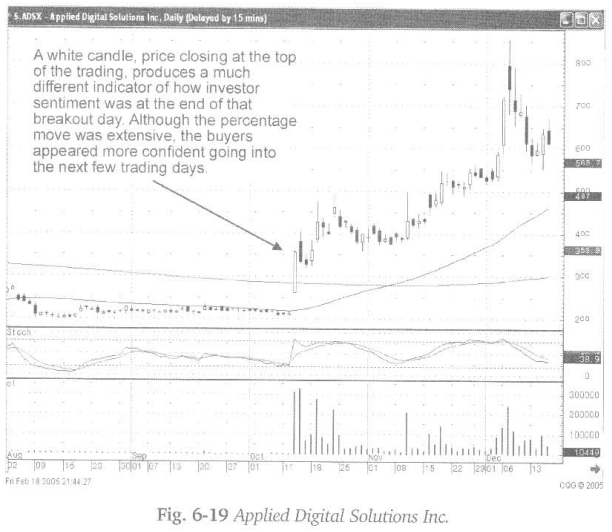
The
common sense that is incorporated into candlestick analysis makes interpreting
a breakout situation relatively easy. The signals are still the important
criteria. The analysis of what the signal represents, in correlation to the
trend, is greatly entranced with simple explanations of what the candlestick
formations are illustrating. Fig. 6-19, The Applied Digital Solutions Inc.
chart revealed important information. The breakout opened and continued to move
up, closing on the high. It moved through the 200-day moving average with no
problems. This becomes a significant message.
The term
breakout can be applied to stocks that have traded in a flat range for an
extended period of time. A giant move to the upside, based on any news
announcement or world event, becomes an important ‘alert’ system. Simple logic
dictates that if a substantial price move takes effect after a particular
event, the price move becomes a beacon for analyzing what a company’s potential
should be in view of that event.
The
development of other formations, after a breakout, becomes very revealing as
far as what the next potential move will be. The evaluation, of what the
reaction should be from investors after an extensive move, is easily analyzed
when understanding candlestick analysis.
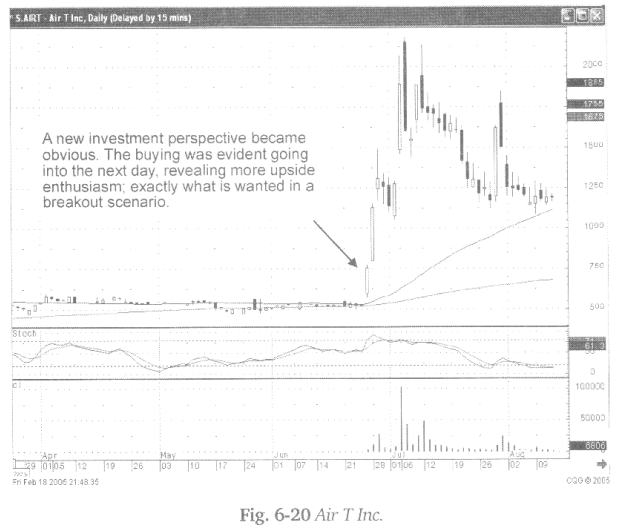
Fig.
6-20, The Air T, Inc. chart illustrates additional buying enthusiasm, even
after a 50% move in the price on the breakout day. The fact that the slight gap
up the following day was followed by continued buying indicated that the buying
pressure had not diminished. This creates a much different evaluation versus
seeing a gap open, followed immediately by selling, or an open that occurred
back down in the previous days trading area.
Having an
immediate visual graphic of what investor sentiment is producing is paramount
when debating whether to hold a position or take profits. When prices increase
dramatically, percentage-wise, in very short period of time, human emotion
factors have to be analyzed very quickly. The greed factor, the fear factor, or
the profit taking aspects have to be accounted for as quickly as possible.
Buying and selling decisions become quicker on the trigger. The fear of not
getting in fast enough or getting out fast enough becomes exaggerated in the
price movement.
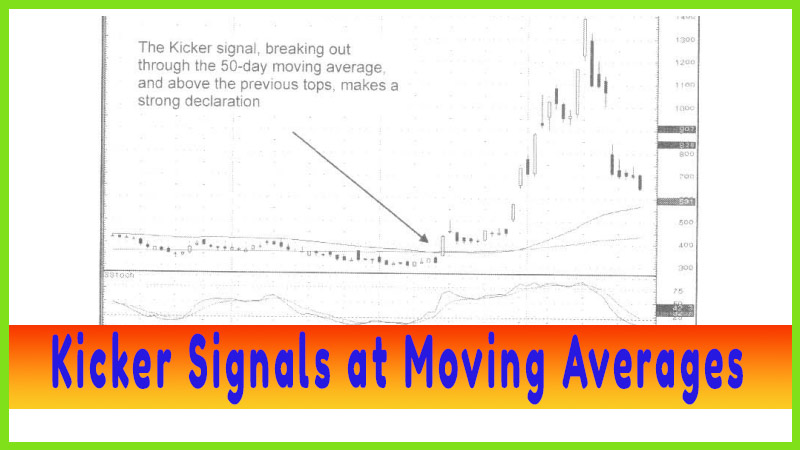
The
elements of a breakout pattern can involve other technical indicators. As seen
in Fig. 6-21, the W R. Grace & Co. chart, the 50-day moving average began
acting as support. Witnessing a big price move becomes the alert.
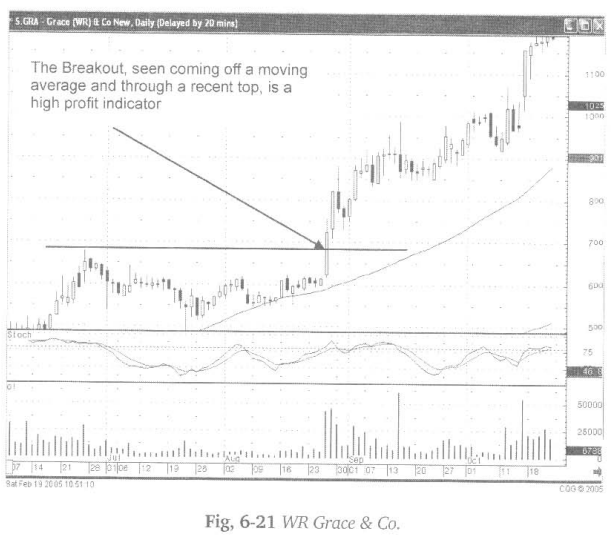
The fact
that the price move was created on big volume is another indicator. A large
price move, accompanied with high volume trading and breaking through the top
of an established price range, is a significant message. It clearly illustrates
that a new dynamic has entered this stock price.
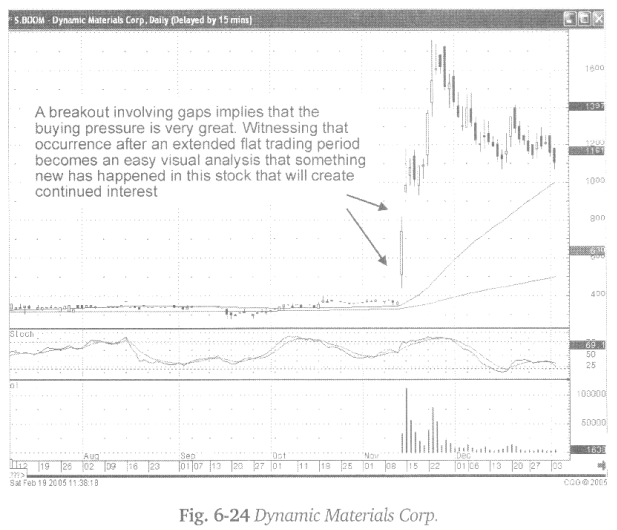
The
combination of a gap up and a large candlestick body, with expanded volume, and
the price breaking out through a resistance level, is a clear message. The
bullish candle formation left little doubt at the end of the day that the
bullish bias was still present. Had a significant shadow been viewed at the end
of the day, to the upside, then a different analysis would have been applied.
The
question arises as to whether this may not be demonstrating exuberance at the
top. That observation would have been more crucial had this been a day of large
buying at the end of an uptrend. In this case, this was a breakout from a flat
trading area, definitely a different trading mode than witnessed in the prior
month and a half.
Breakouts
can also occur in an established trend. If they can clearly be observed in a
price pattern, such as a trading channel, and a large-volume price movement
breaches that trading area, that breakout now reveals new investor sentiment
coming into the price. How a price moves out of the norm, in a trading pattern,
is illustrated by the candlestick formation. The information revealed in that
formation can be used to great advantage for entering very profitable trades.
Does a
breakout always immediately signify massive gains? Not always! However, a
breakout from an established trading area should at least be the shot across
the bow. Notice in Fig. 6-22, the Catalina Marketing Corp, chart, the breakout
was obvious. Yet the main thrust of the uptrend did not occur until three weeks
to a month later. The gap up from the breakout day now becomes an important
factor. The pullback, after the initial breakout, appeared to stop at the
bottom of the bullish breakout candle. The fact that the 50-day moving average and
the 200-day moving average crossed as the price came back to the bottom of the
breakout candle adds significance.

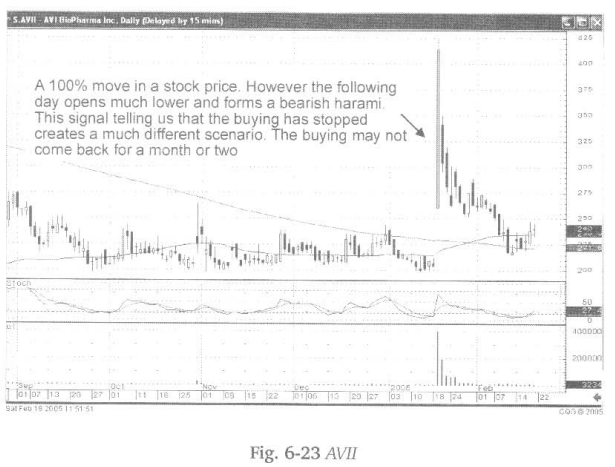
The
candlestick signals provide relevant information in a breakout situation.
Notice in Fig. 6-23, the AVII chart how a breakout, that more than doubled the
price of the stock, was followed the next day by a Bearish Harami. That
information provides a completely different scenario than if the buying was
still present the day after the breakout. This is nothing more than utilizing
what the Japanese Rice traders have observed for centuries.
Will the
price of this stock eventually recover to the high of the breakout? More than
likely. That provides the candlestick investor with an alert system to watch
for new activity in this stock. Keep in mind, the basic element of a breakout
situation is that a new dynamic has entered into the stock. The probabilities
indicate that the new dynamic will not disappear after one day of trading.
Whatever news or event that affects the price greatly is probably going to be
revisited within a reasonable amount of time.
A huge
move? What do the candlestick formations tell you is happening at the end of
the trading day? This information is valuable. The proper evaluation of a
breakout candle can produce very large profits.
How do
you find a breakout situation? This is a very simple scan. It involves finding
the stocks that have the biggest percent move during a given timeframe.
Breakouts are usually news-driven. They can be found in all-priced stocks.
Volume will have a great important also. Volume should be significantly greater
than a normal trading day. Some common sense still needs to be applied when
evaluating volume. A stock that normally trades 3200 shares a day that has a
big moves on 40,000 shares a day should not have as much relevance as a stock
that normally trades 200,000 shares a day and moves up to 4 million shares in
one day. Logic dictates that a low-volume stock can be moved around by one
purchaser.
Breakouts
are the result of something significantly different happening for the future
potential of a company (or any other trading entity). That result can be
visually analyzed in the candlestick bodies following the breakout move. Simple
analysis wants to identify whether the buyers are still involved. The presence
of more ‘buy’ signals, such as gaps up, acts as an efficient analytical tool.
The strength of an up move will be predicated upon the candlestick formations
appearing during or very soon after a breakout candle appears. As with all
analysis of candlestick signals, a black candle following a breakout does not
necessarily reveal a reversal if that black candle does not portray a
candlestick ‘sell’ signal.
The same
rules for analyzing candlestick signals in a normal trend should be applied in
a fast-moving breakout situation. A Shooting Star on a second day of a breakout
still requires confirmation the following day. A Bearish Harami reveals a
different scenario.
The
elements that form a breakout situation can produce extremely large profits for
the investor that takes the time to analyze what the candlestick formations are
revealing. Is it worth chasing a stock that is already up 40% on the day? If
you can interpret what the chart pattern is revealing, using candlestick
formations, the fear of chasing can be eliminated. The confidence that comes
with understanding what that chart formation can produce allows the candlestick
investor to participate in analyzed and calculated trades.
How To make High Profit In Candlestick Patterns : Chapter 5. Candlestick Signals and Patterns : Tag: Candlestick Pattern Trading, Forex : Single candlestick patterns, Types of candlesticks, Powerful candlestick patterns, Types of candlesticks, Candlestick chart analysis, Bearish candlestick patterns, Breakout Trading - Breakout Trading Strategy