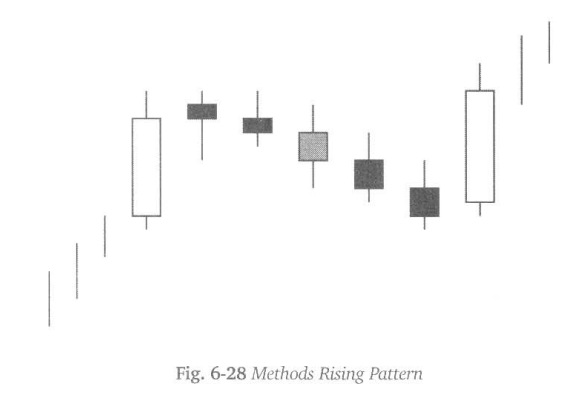
The Methods Rising Pattern
Single candlestick patterns, Types of candlesticks, Powerful candlestick patterns, Types of candlesticks, Candlestick chart analysis, Bearish candlestick patterns
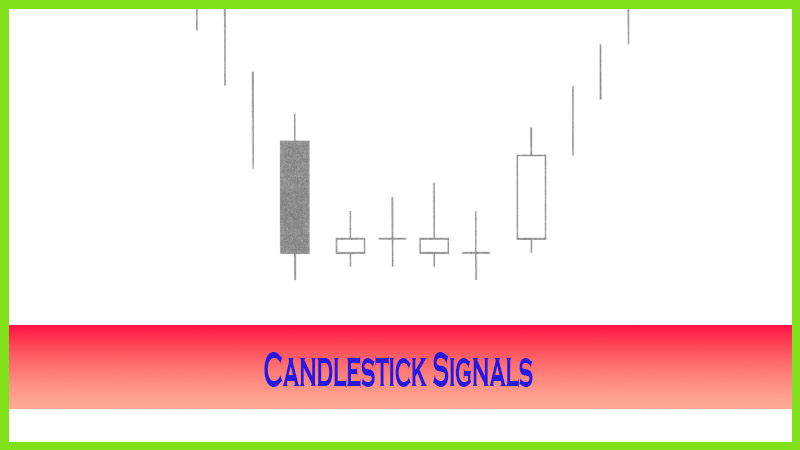
Course: [ How To make High Profit In Candlestick Patterns : Chapter 5. Candlestick Signals and Patterns ]
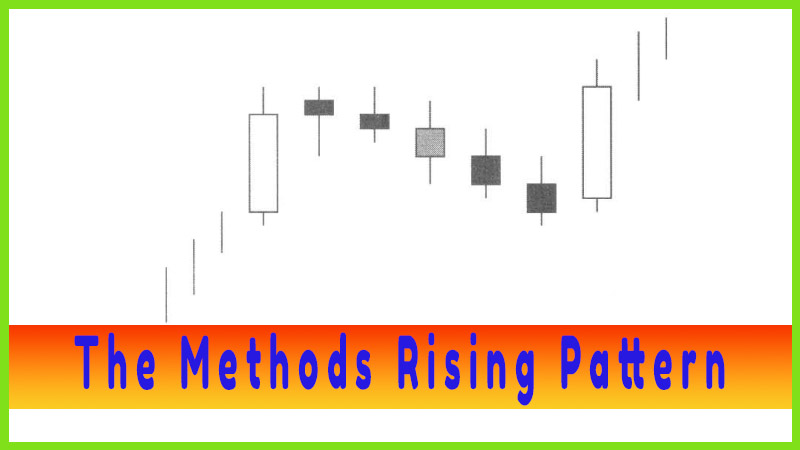
The Methods Rising Pattern is a derivative of the Three Methods Rising pattern. The Three Methods Rising pattern is a candlestick continuation pattern.
The Methods Rising Pattern
The
Methods Rising Pattern is a derivative of the Three Methods Rising pattern.
The Three Methods Rising pattern is a candlestick continuation pattern.
Although the continuation patterns are not addressed in this book, the Methods
Rising pattern occurs frequently enough to include it in the High Profit
Patterns chapter.
The Three
Methods Rising pattern consists of a large bullish candle during an uptrend.
The following three days are indecisive bearish candles. The Methods Rising
Pattern consists of three or more indecisive bearish trading days.
The Methods Rising Pattern
1.
Usually considered the Three
Methods Rising pattern, where once a bullish candle is formed, three pullback
days are seen before the next bullish candle.
2.
The Methods Rising Pattern is an
extension of a Three Methods Rising pattern, having 3, 4, 5, or 6 indecisive
pullback days before viewing the next bullish candle.
3.
The pullback days are usually
indecisive days, Doji’s or Spinning Tops, demonstrating that the sellers are
not acting forcefully.
4.
The final pullback day does not
close below the open of the last bullish candle. This discourages the Bears.
5.
The final day opens higher than
the close of the previous day and finally closes above the close of the last
bullish candle. This illustrates that the Bulls are now back in the trend. The
trend should continue upwards.
An
important aspect of the pattern is the ‘pullback’ days. Witnessing indecisive
bearish trading days divulges crucial information. The selling is occurring
without any great conviction. There will usually be Spinning Tops, Doji, small
Hammers or small Inverted Hammer signals. Another important factor is that the
final bearish day does not close below the open price of the previous bullish candle.
The fact that the Bears could not move the price below the open of the last
bullish candle makes them discouraged. It also gives the Bulls confidence.
The
following day should open higher. The buying, seen from the confidence of the
Bulls, will take the closing price above the closing price of the previous
bullish candle. This illustrates that the Bears have stepped out of the way.
The Bulls are back in control. The uptrend has an extremely high probability
of continuing from these levels, provided the stochastics indicate more upside.
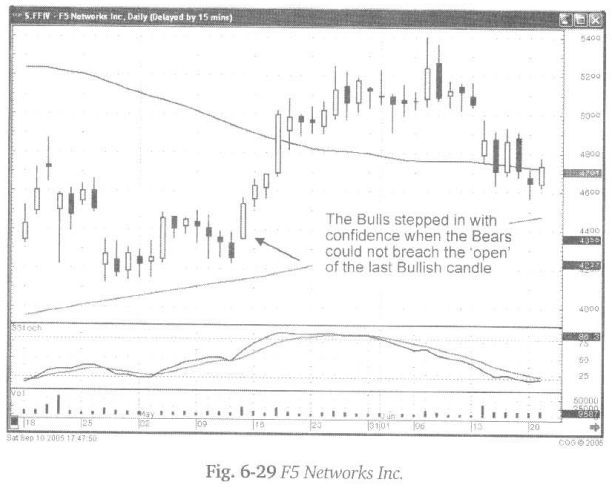
Fig. 6-29
(following page), The F5 Networks Inc. chart demonstrates how the Bulls
overcame the Bears when they could not reverse the trend after six days. The
Bulls, with new confidence, start taking the trend up to much higher levels.
The significant factor was that the Bears could not close the price below the
open of the last bullish candle.
How To make High Profit In Candlestick Patterns : Chapter 5. Candlestick Signals and Patterns : Tag: Candlestick Pattern Trading, Forex : Single candlestick patterns, Types of candlesticks, Powerful candlestick patterns, Types of candlesticks, Candlestick chart analysis, Bearish candlestick patterns - The Methods Rising Pattern