Kicker Signals at Moving Averages
Single candlestick patterns, Types of candlesticks, Powerful candlestick patterns, Types of candlesticks, Candlestick chart analysis, Bearish candlestick patterns
Course: [ How To make High Profit In Candlestick Patterns : Chapter 5. Candlestick Signals and Patterns ]
The Kicker signal, the most powerful candlestick signal! As described earlier, the Kicker signal is formed when something dramatic has changed the investor sentiment. The Kicker signal should never be ignored. It has the capability of producing extremely large profits.
Kicker Signals at
Moving Averages
The
Kicker signal, the most powerful candlestick signal! As described earlier, the
Kicker signal is formed when something dramatic has changed the investor
sentiment. The Kicker signal should never be ignored. It has the capability of
producing extremely large profits. The news event or announcement, that creates
the signal, changes investor sentiment so greatly that the trend will probably
move in the new direction for a lengthy period of time.
The
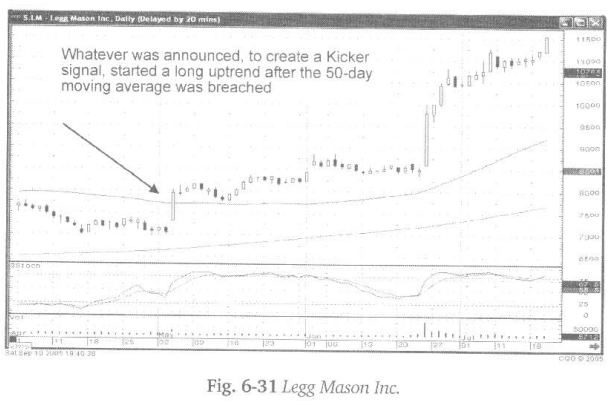
Kicker signal does not require the evaluation of the stochastics. However, a
Kicker signal, formed at or near major moving averages, increases the
significance of the signal. What is the reasoning behind this phenomenon? It
could be the added implication that the price is not going to remain at the
normal price area, the moving averages.
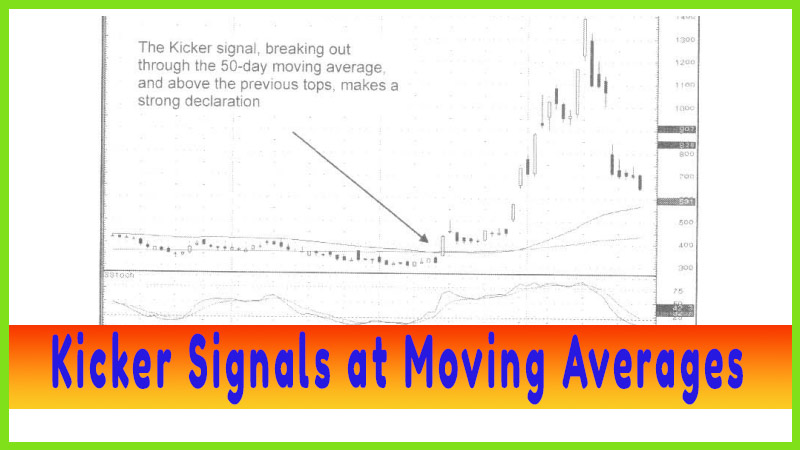
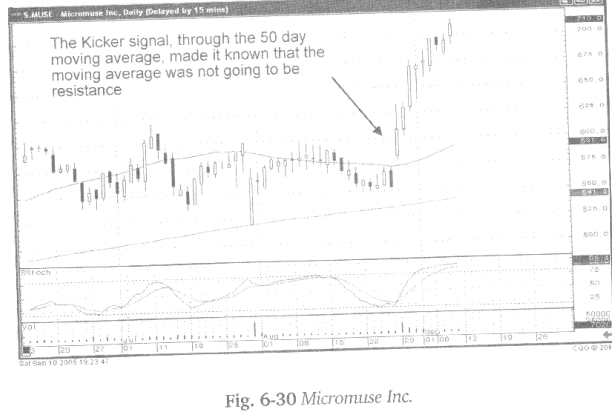
Additionally,
the gapping of the price movement up through a moving average implies that the
moving average will not act as resistance. As seen in the Micromuse Inc. chart,
a Kicker signal gaps up through the 50-day moving average. This becomes
relevant information. Massive buying strength at an important technical level!
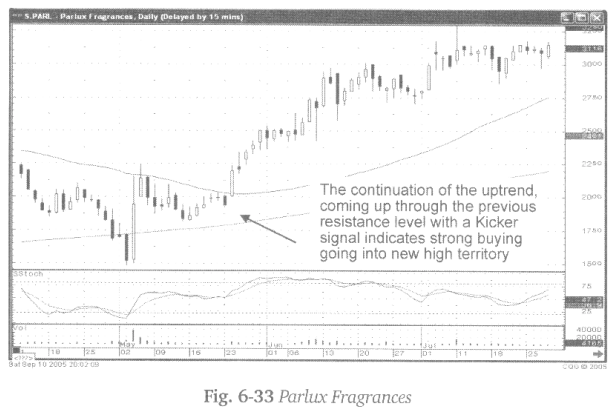
What is
the common reaction to a stock price that may have gapped up 10% to 20% in one
day? Most investors will shy away after a price move of that magnitude. That is
unfortunate! The information conveyed in a Kicker signal, moving through or
away from a moving average, will produce powerful results.
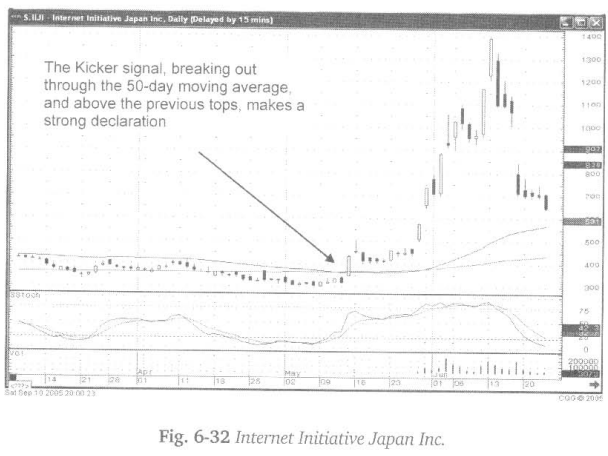
Recognize
the signal. When you see it, take advantage of it. Technical analysis is the
utilization of previous price movements. Candlestick analysis exploits patterns
that have produced significant profits in the past. Kicker signals, witnessed
at major moving averages, will produce huge profits for your account.
How To make High Profit In Candlestick Patterns : Chapter 5. Candlestick Signals and Patterns : Tag: Candlestick Pattern Trading, Forex : Single candlestick patterns, Types of candlesticks, Powerful candlestick patterns, Types of candlesticks, Candlestick chart analysis, Bearish candlestick patterns - Kicker Signals at Moving Averages