The Cradle Pattern Signals
Single candlestick patterns, Types of candlesticks, Powerful candlestick patterns, Types of candlesticks, Candlestick chart analysis, Bearish candlestick patterns
Course: [ How To make High Profit In Candlestick Patterns : Chapter 5. Candlestick Signals and Patterns ]
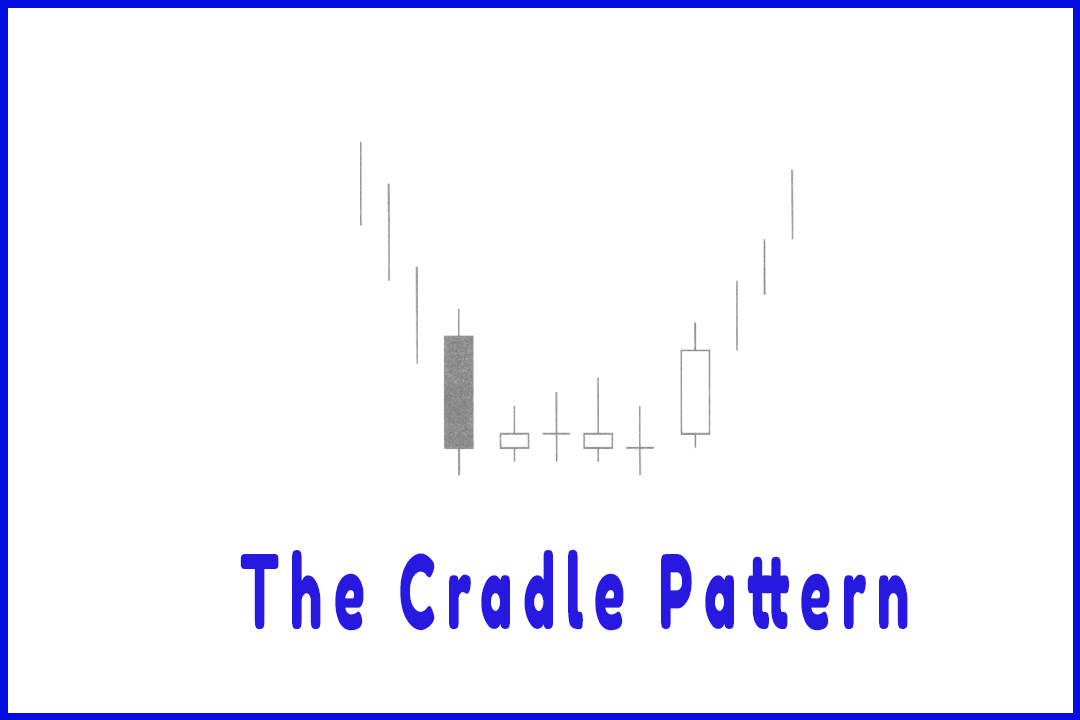
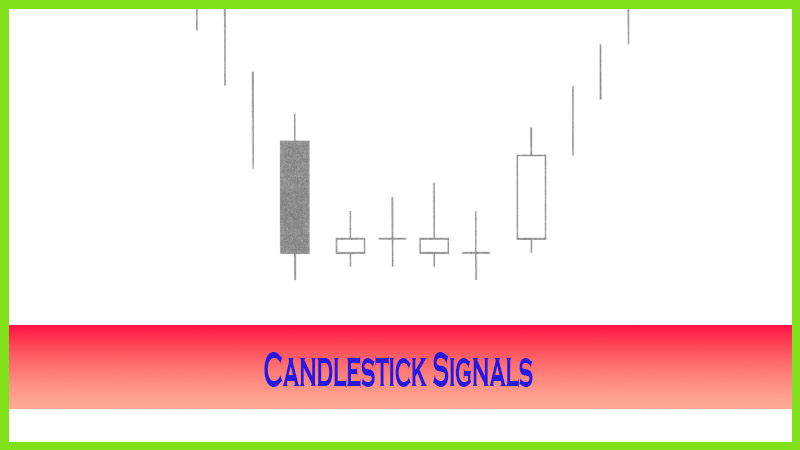
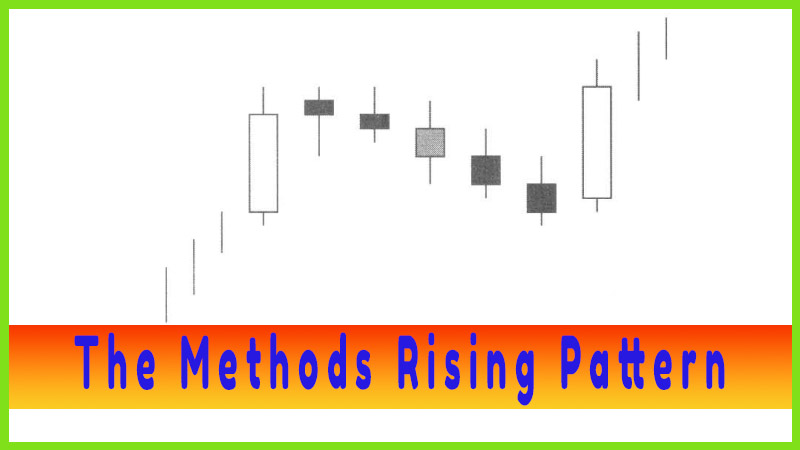
A variation of the series of Doji at the bottom is the Cradle pattern. The Cradle pattern is aptly named. It looks like a cradle hanging at the bottom. This reversal pattern is easy to identify. It begins with the same visual alert as found in most candlestick bottoming signals; a large bearish candle at the bottom of a downtrend. This illustrates the extensive selling at the bottom.
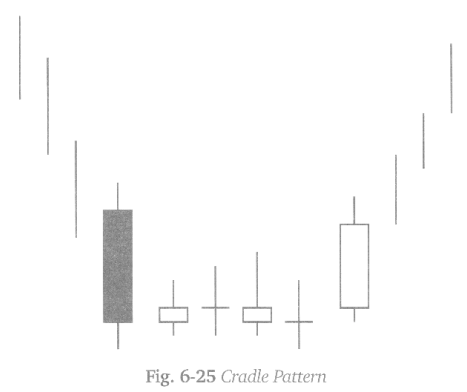
The Cradle Pattern
A
variation of the series of Doji at the bottom is the Cradle pattern. The Cradle
pattern is aptly named. It looks like a cradle hanging at the bottom. This
reversal pattern is easy to identify. It begins with the same visual alert as
found in most candlestick bottoming signals; a large bearish candle at the
bottom of a downtrend. This illustrates the extensive selling at the bottom.
The following day shows a candlestick signal such as a Doji, Spinning Top,
Harami, Hammer or Inverted Hammer, indicating that the selling had stopped.
What will a candlestick investor be watching for? Confirmation of the buy
signal! However, for a number of days, small indecisive trading days occur. The
indecisive trading occurs in a relatively flat trading area.
The Cradle Pattern
Description
After an
extended downtrend, a large dark candle forms,
1.
A candlestick signal such as a
Harami, Hammer or Doji signal indicates that the selling has stopped.
2.
The next three, four, five, or
more days reveal indecisive trading.
3.
The confirmation of the Cradle
Pattern is a large bullish candle. The large bearish candle acts as the
headboard. The large bullish candle acts as the footboard.
4.
The indecision days in between
become the ‘sleepy’ days.
5.
The signal pattern is very
symmetrical. It illustrates a definite change of investor sentiment after an
indecisive trading span. It is a derivative of the series of Doji at the bottom
A bullish
candle reveals what investor sentiment decided after the indecisive trading
period. If the large dark candle is considered the headboard, the bullish
candle becomes the footboard. The cradle formation is now hanging at the
bottom, implying that the trend should move up from this level.
Fig.
6-26, The Marchex Inc. chart reveals the indecision occurring at the end of an
extended downtrend. Notice the stochastics remained in the oversold area for a
number of weeks prior to this pattern demonstrating a change of investor
sentiment.
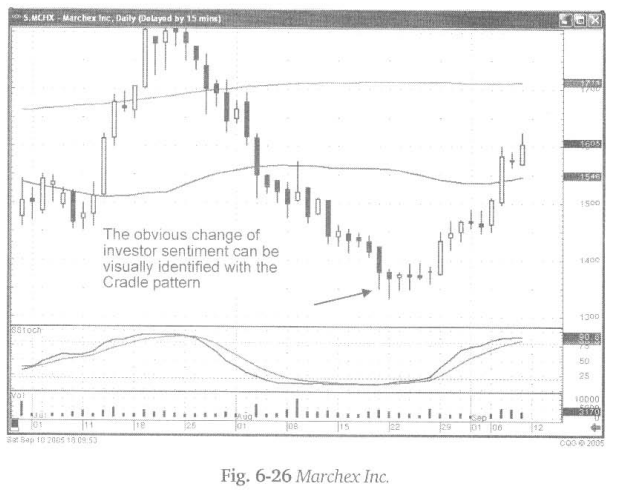
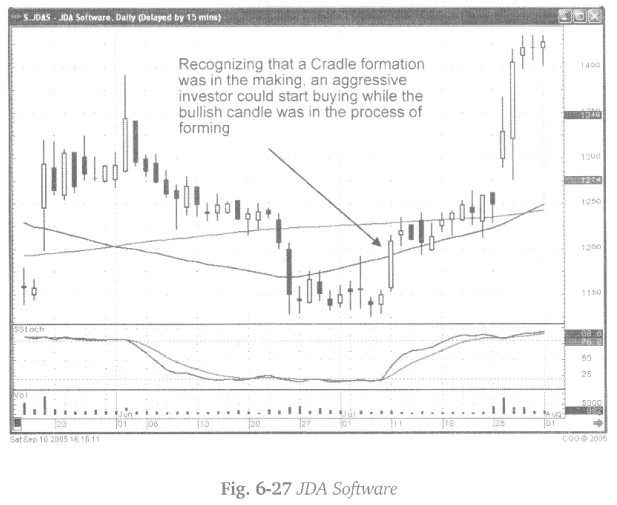
Fig. 6-27
(following page), The JDA Software chart exhibits a Cradle pattern. It should
be noted that from the appearance of the long dark candle, a headboard, to the
appearance of the long bullish candle, numerous candlestick signals could be
identified. Doji’s and Spinning Tops illustrated the lack of conviction by
both the Bulls and the Bears. The important visual aspect of the indecisive
trading was that price traded completely flat for approximately a two- week
period.
Recognizing
there was no definitive direction, after the last large dark candle, the
candlestick investor can be prepared for the large bullish candle. If watching
closely, a position could be established upon seeing strength coming in the day
the footboard was forming.
The
Cradle pattern, the same as the series of Doji’s at the bottom, demonstrate
that the Bulls and the Bears cannot figure out what to do with prices at the
bottom. A large bullish candle, completing the Cradle formation, immediately
declares where investor sentiment has moved. This is a high probability reversal
pattern. Any time a series of indecisive trading signals can be identified, the
likelihood of a strong trend occurring afterwards is very strong. Once the
direction is disclosed, the price move will usually be significant. The
elements for making this a successful trade are already in place. After an
extended downtrend, the stochastics will be in the oversold condition. A
bullish signal, forming after the indecisive signals, becomes your ‘buy alert.’
How To make High Profit In Candlestick Patterns : Chapter 5. Candlestick Signals and Patterns : Tag: Candlestick Pattern Trading, Forex : Single candlestick patterns, Types of candlesticks, Powerful candlestick patterns, Types of candlesticks, Candlestick chart analysis, Bearish candlestick patterns - The Cradle Pattern Signals