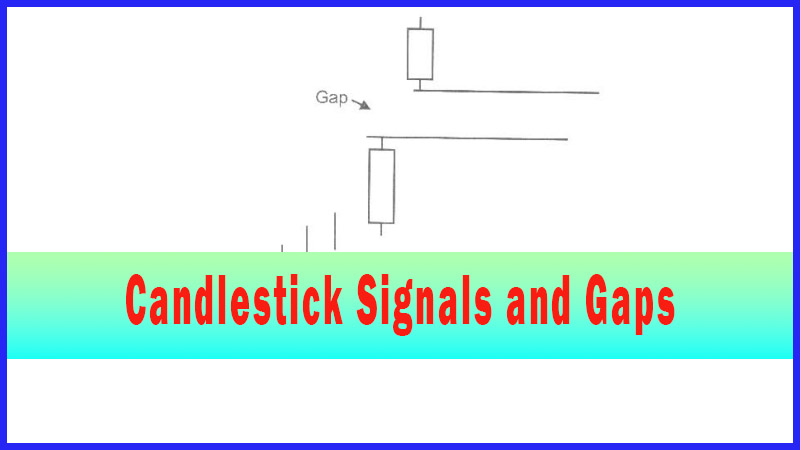
Candlestick Gap up at the Bottom
Profitable Candlestick Trading, Harami signal , bearish candle, Reversal Pattern, Candle Gap analysis
Course: [ How To make High Profit In Candlestick Patterns : Chapter 3. High Profits Using Gaps ]

A gap, appearing after a candlestick “buy” signal, has powerful implications. Knowing that a gap represents enthusiasm, getting in or out of a stock position becomes an easy identification process.
A Gap up at the Bottom
A gap, appearing after a candlestick “buy” signal, has powerful
implications. Knowing that a gap represents
enthusiasm, getting in or out of a stock position becomes an easy
identification process. The forewarning that a strong profit potential
situation is about to or has occurred is established. Where is the best place
to see rampant enthusiasm? At the point you are buying, near the bottom.
Obviously, seeing a potential Candlestick “buy” signal, at the bottom of an
extended downtrend is a great place to buy. In keeping with the concepts taught
in Candlestick analysis, we want to be buying stocks that are already oversold,
to reduce the downside risk. Evidence that buyers are very anxious to get into
the stock is all that much better.
Reiterating
the basics of finding the perfect trades, as found in the Article “How To make High Profit in Candlestick Patterns,”
having all the stars in alignment makes for better probabilities of producing a
profit. The best scenario for a high-profit trade is a candlestick “buy”
signal, in oversold condition, confirmed with a gap up the following day.
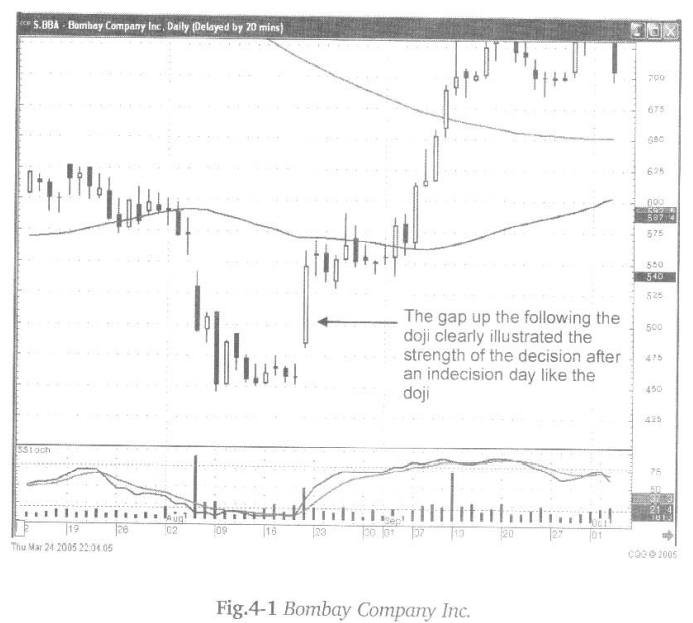
Illustrated in Fig. 4-1, the Bombay Company, Inc. chart, the uptrend was
obviously instigated after a gap up and large bullish candle following a Doji.
The fact that prices gapped up was clear illustration that buyers wanted to get
into this stock with great fervor.
Unofficially,
statistics illustrate an 80% or better probability that a trade will be
successful when stochastics are oversold, a Candlestick “buy” signal appears,
and prices gap up. (The Candlestick Forum will offer our years of statistical
figures as “unofficial.” Even though over fifteen years of observations
and studies have been involved, no formal data gathering programs have been
fully operated. However, currently the Candlestick Forum is involved with two
university studies to quantify signal results. This is an extensive program
endeavor. Results of these studies will be released to Candlestick Forum
subscribers upon completion. This study has been long and difficult, but
results are expected sometime in the near future.)
Having
this statistic as part of an investor’s arsenal of knowledge creates
opportunities to extract large gains out of the markets. The risk factor
remains extremely low when participating in these trade set-ups.
Many
investors are afraid to buy after a gap up. The rationale being that they don’t
like paying up for a stock that may have already moved 3%, 8%, 10%, or 20%
already that day. Witnessing a Candlestick “buy” signal prior to the gap up
provides a basis for aggressively buying the stock. If it is at the bottom of a
trend, the 3%, 8%, 10% or 20% initial gap move may just be the beginning of a
50% move or a major trend that can last for months.
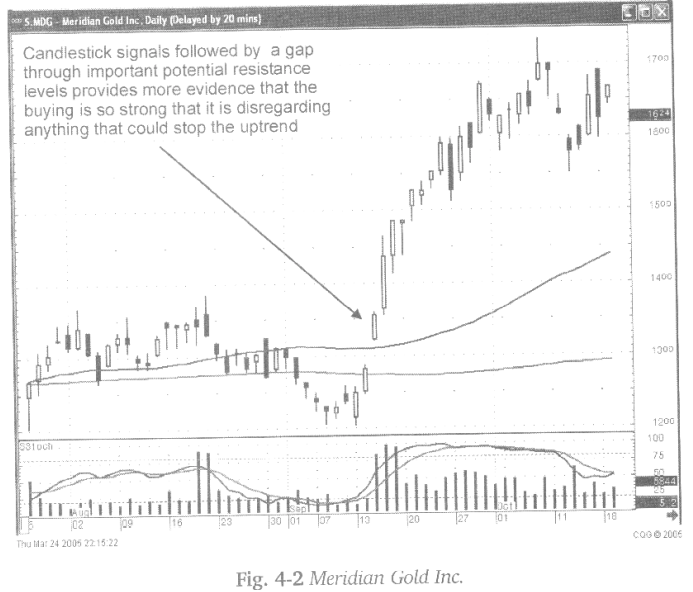
The
strength of an uptrend can be better verified when the gap in price moves up
past potential resistance levels. As illustrated in Fig. 4-2, the Meridian
Gold Inc. chart, the price gapped up over the 50-day moving average, what had
previously been acting as a resistance area. The strength of the buyers is
clearly represented. The fact that the price breached the moving average, while
still forming a bullish candle after the open price, illustrates that the
buying sentiment did not diminish after the dramatic increase in price.
The
more parameters in place, confirming an uptrend, the higher the probability of
being in a correct trade. Add to that the confirmation of excessive buying
strength, a gap up in price, the higher the probabilities that a strong uptrend
is occurring.
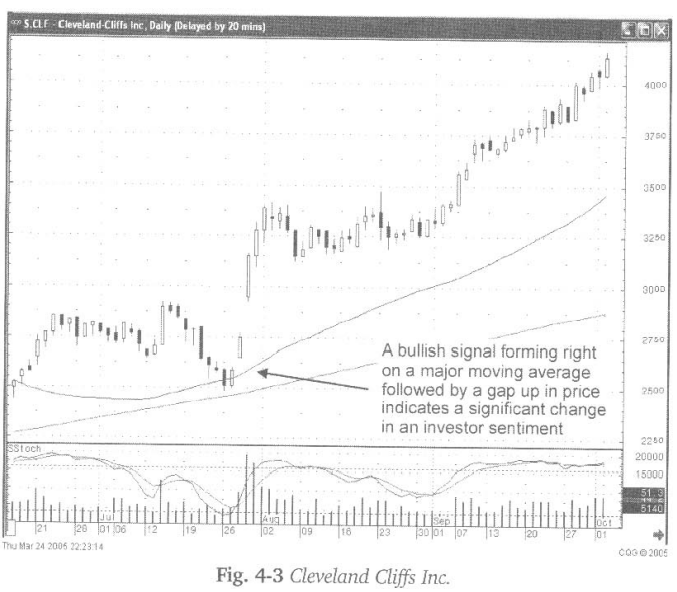
Fig.4-3,
The Cleveland Cliffs Inc. chart reveals a Bullish Harami forming right on the
50-day moving average followed by a gap up in price. First, the Bullish Harami
forming on the 50-day moving average became a good indication that the moving
average was going to act as support. The gap up the following day made it
evident that many buyers felt the same way. If one gap shows enthusiastic
buying, two gaps reveal that much more strength. The trend is your friend, an
often the spoken adage. Gaps, when used correctly, are your best friends.
This
is not a difficult analysis. Witnessing a candlestick buy signal followed by
exuberant buying is exactly the type of trade an investor should be looking
for.
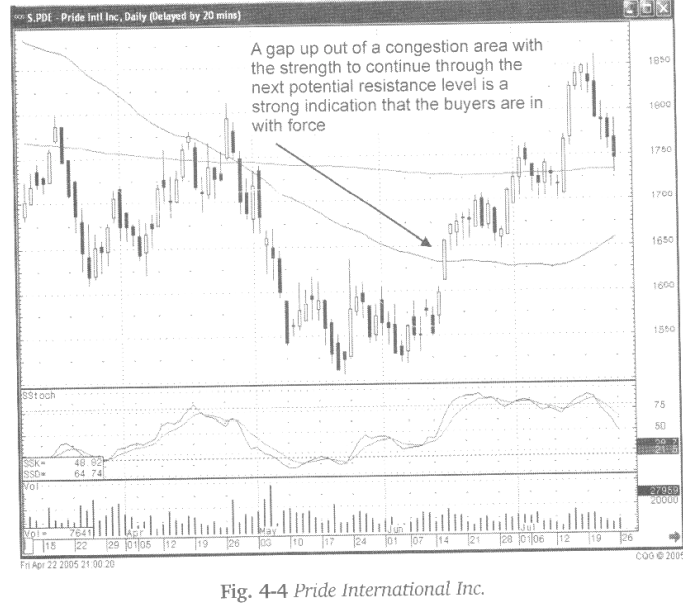
Fig.
4-4, The Pride International Inc. chart illustrates how the enthusiastic buying,
after a candlestick signal, provides the confirmation that a strong uptrend is
in progress. Notice how the Kicker type signal, a strong bullish indication in
itself, precludes the strong uptrend. The next day it gaps up on a strong
bullish candle. The gap up, followed by strong continued buying, reveals a
number of bullish observations.
The
gap occurs at what could be considered a mild resistance level. The price
appeared to have trouble closing above the $16 level. When the price gapped up
through drat area, it revealed that the $16 area was not acting as resistance
any more. Next, the strong bullish candle went through the 50-day moving
average. That average acted as a resistance level earlier. Witnessing price
moving out of a trading range and through potential resistance should indicate
that a new dynamic has come into the price trend.
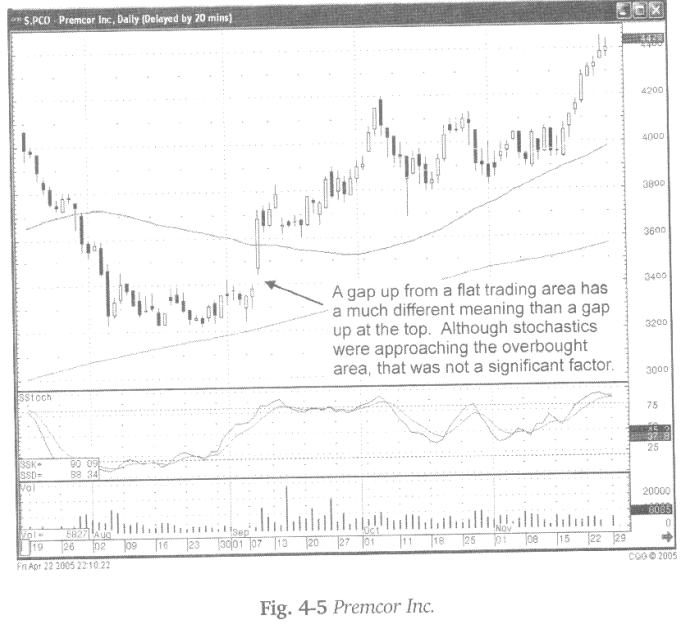
Candlestick
analysis can also be applied to what a price was doing before a significant buy
situation. As seen in Fig. 4-5, the Premcor Inc. chart, August was a period of
indecisive trading. There would not have been anything in the trading, during
that time, that provided any reason to get excited about getting into that
stock position. The gap up, out of the congestion area, now becomes a clear
indication that new investor sentiment has entered this stock trend.
Once
the gap up, followed by a strong bullish candle was observed, candlestick
analysis of the prior month of trading becomes useful. Although the daily trading
ranges were relatively insignificant, they were showing small bullish candlestick
signals. Upon reviewing the trading during that time, it becomes obvious that
it was forming a basing range. That information now becomes useful for
analyzing the gap up.
The
congestion area formed a resistance level at the $34 price. Once the price gapped
up through that level, it became immediately obvious that the $34 level was not
acting as resistance any more. Next, the large bullish candle went straight
through the 50-day moving average without any problems. Obviously, the 50-day
moving average was not going to act as resistance. Being able to analyze what
happened prior to the gap up allows the candlestick investor to better evaluate
what was going on in investor sentiment. Although stochastics was now nearing
the overbought area when the gap up occurred, the strength with which the
buyers started entering into the stock price produces a different scenario. A
breakout from the congestion area meant new enthusiasm was coming into the
stock price.
A
gap up occurring at a top of a trend, with stochastics in the overbought area,
might have a much different conclusion. In this case, the gap up did not occur
at a top of a trend. As observed, the trend was sideways prior to the gap up.
This observation would put a different importance on the location of the
stochastics.
Being
able to analyze what the candlestick signals were doing prior to a gap up
produces valuable information for entering high-profit trades. Preparing one’s
eyes for successful and powerful price-movement setups aids an investor in
being mentally ready to immediately exploit a high profit potential signal.
This is a simple process. Having a mental picture of how a high-profit potential
trade begins helps an investor enter that trade at a very early stage. This not
only benefits the profitability; it also reduces loss potential. Entering a gap
up situation in the very early stages of its development, provides more
effective time and price entry levels to get in and out of the trade if it
doesn’t reach full expectations.
How To make High Profit In Candlestick Patterns : Chapter 3. High Profits Using Gaps : Tag: Candlestick Pattern Trading, Forex : Profitable Candlestick Trading, Harami signal , bearish candle, Reversal Pattern, Candle Gap analysis - Candlestick Gap up at the Bottom