Gaps at the Top Reveal Exuberance
candlestick chart gap top pattern, Gap-up, Gap-down, High Profit pattern
Course: [ How To make High Profit In Candlestick Patterns : Chapter 3. High Profits Using Gaps ]

Exuberance at the top is depicted with the formation of long candles or a gap up. When either or both of these situations occur, be prepared for a candlestick sell signal to soon follow. This becomes a simple visual analysis.
Gaps at the Top Reveal Exuberance
“Each problem that I solved became a rule, which served
afterwards to solve other problems.”
Exuberance
at the top is depicted with the formation of long candles or a gap up. When
either or both of these situations occur, be prepared for a candlestick sell
signal to soon follow. This becomes a simple visual analysis. Being able to
correctly interpret the investor sentiment conveyed in a gap up at the top becomes
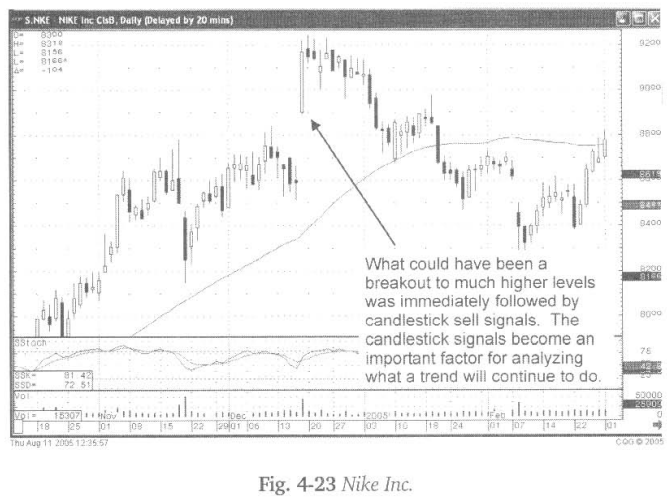
an important decision-making factor. Fig. 4-23 (following page), The Nike Inc.
chart reveals a gap up followed by strong buying when stochastics is well in
the overbought area. The following four or five trading days indicate
indecisive movement between the Bulls and the Bears at those high levels. The
big trading day either revealed that something major was happening in the stock
price or it was the final exuberant buying. The fact that the next five days
showed indecisive trading, no bullish follow through, now provides a better
picture of what is happening to investor sentiment.
Described
in the “Stop Loss” chapter later in the book,
effective stops can be placed upon a gap up in overbought condition. Simple
techniques allow for reaping the majority of the potential returns from a
trend.
When
prices gap up in overbought conditions the potential for forming a candlestick
‘sell’ signal becomes favorable. Prices backing off from those levels can form
a Dark Cloud or Bearish Engulfing signal if they continue weak for the rest of
the trading day. Even if prices come back up to the top of the trading range, a
signal such as the Hanging Man or a Doji could be formed.
If
prices continue higher, and pull back by the end of the day then a Shooting
Star can be formed. Once a gap up occurs, the only possibility of a candlestick
sell signal not appearing is when prices open higher and then continue to trade
to the higher end of the trading range. If this is the case, the placement of
stop losses, as recommended in the “Stop Loss" chapter, will not be
affected. Profits will continue to be made. However, the point of being
prepared for a gap up at the top is based on probabilities. The “probabilities” a trend is over is much greater than
anticipating the trend going higher.
Fig.
4-24, The XM Satellite Radio Holdings Inc. chart illustrates that the sellers
are ready to take over, after an extended uptrend that is followed by a gap up.
Unless something dramatic is about to occur, such as an announcement of good
news for the company, it is likely that the uptrend is over. This assumption is
based upon the visual observations over the past few centuries. Why invest
against the probabilities?

If
the gap up is substantial, and it continues higher, put the stop at the open
price level. On any of the scenarios described, the price moving back to the
‘stops’ would more than likely create signals that warranted liquidating the
trade, forming Shooting Stars, Dark Clouds, Meeting Lines or Bearish Engulfing
patterns. In any case, sellers were making themselves known. It is time to take
profits in the high-risk area and find low risk ‘buy’ signals at the bottom of
a trend.

The
candlestick investor requires nothing more than the training of the eye to
recognize high probability patterns. A large gap up in an overbought condition
provides a definite decision-making process. As a rule, the appearance of
exuberant buying is the time to be prepared to take profits. The question that
should always be asked, “When
prices are going through the roof, when the accompanying news appears to make
the future look very bright, who is selling?”
How To make High Profit In Candlestick Patterns : Chapter 3. High Profits Using Gaps : Tag: Candlestick Pattern Trading, Forex : candlestick chart gap top pattern, Gap-up, Gap-down, High Profit pattern - Gaps at the Top Reveal Exuberance