High Profits Using Gaps
gap trading strategy, gap trading stocks, candlestick gap patterns, candlestick gap analysis
Course: [ How To make High Profit In Candlestick Patterns : Chapter 3. High Profits Using Gaps ]

Gaps occurring at different locations in a trend have different meanings. Taking advantage of what they reveal becomes highly profitable. Dissecting the implications of a gap/window makes its appearance easy to understand. Where a gap occurs is important.
Combining Candlestick Signals and Gaps
“He who fears something gives it power over him.”
Gaps
occurring at different locations in a trend have different meanings. Taking
advantage of what they reveal becomes highly profitable. Dissecting the
implications of a gap/window makes its appearance easy to understand. Where a
gap occurs is important. The ramification they reveal in a chart pattern is an
important aspect to Japanese Candlestick analysis. Some traders make a living
trading strictly from gap trading.
Gaps
(ku) are called windows (Mado) in Japanese Candlestick analysis. A gap or
window is one of the most misunderstood technical messages. It is usually
advised by a good percentage of investment advisors not to buy after a gap. The
explanation being that it is too dangerous to predict what will happen next.
That advice usually comes from somebody that does not know how to use gaps
successfully. Gaps reveal powerful high profit trades. Candlestick signals,
correlated with the appearance of a gap, provide high-probability profitable
trade set-ups. The unique built-in forces, encompassed in the candlestick signals,
and the strength of a move revealed by the existence of a gap produce powerful
trading factors. The knowledge of what this combination of signals reveal will
produce consistent and strong profits.
These
are not “hidden” secret signals or newly discovered formulas that are just now
being exposed to the investment world. These are a combination of widely known,
but little used, investment techniques. Candlestick signals obviously have a
statistical basis to them or they would not still be in existence after many
centuries. Gaps have very powerful implications. Combining the information of these
two elements produces investment strategies that very few investors take the
time to exploit.
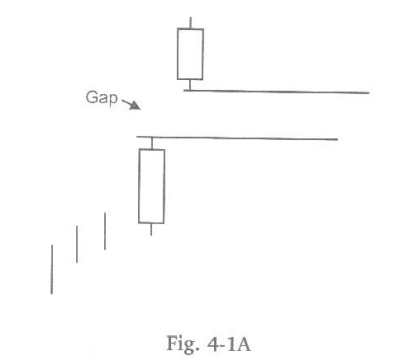
Consider
what a window or gap represents, in a rising market, it illustrates prices
opening higher than any of the previous days trading range. What does this mean
in reality? During the non-market hours, something made owning a stock, or any
other trading entity, tremendously desirable. So desirable that the order
imbalance opens the price well above the prior day’s body as well as the high
of the previous days trading range. As seen in Figure 4-1 A, note the space
between the high of the previous day and the low of the following day.
Witnessing
a gap or window at the beginning of a new trend produces profitable
opportunities. Gaps formed at the beginning of the trend reveal the buyers have
stepped in with a great amount of zeal. A common scenario is witnessing a
prolonged downtrend. A Candlestick signal appears; a Doji, Harami, Hammer, or
any other signal that would indicate that the investor sentiment is changing.
What is required to verify a candlestick reversal signal at the bottom? More
buying the next day! A bullish candle indicates a reversal has occurred. A
“gap up” bullish candle indicates that a reversal has occurred with extraordinary
force.
Many investors are apprehensive about buying a stock that has popped up from the previous days close. A risky situation! The hesitancy is caused by the percentage move. When most investors are happy with a 10% return annually it is hard for an investor to commit funds to a position that has moved 12% in one day. Understanding what that gap up represents eliminates fear.
A
Candlestick investor has been forewarned that the trend is going to change,
viewing the candlestick signal as an alert. A gap up, illustrating buyer
enthusiasm, reveals excessive strength. Use the gap as a strength indicator.
The fact that the initial move is substantial should act as an indication that
the remaining move of this new trend could be more substantial.
Always
keep in mind, the markets do not care what an investors’ fears and perceptions
are. A price that has moved dramatically in one day is usually cause for fear.
Entering a trade for most investors becomes forbidding. They do not have the
knowledge to understand what that strength illustrates for the future.
How To make High Profit In Candlestick Patterns : Chapter 3. High Profits Using Gaps : Tag: Candlestick Pattern Trading, Forex : gap trading strategy, gap trading stocks, candlestick gap patterns, candlestick gap analysis - High Profits Using Gaps