Doji Followed by a Gap Up
Candlestick analysis, Doji after gap down, Doji after downtrend, Doji gap up
Course: [ How To make High Profit In Candlestick Patterns : Chapter 3. High Profits Using Gaps ]

The Doji is one of the most informative signals in candlestick analysis. It appears at many significant points in a trend. In addition to its being a relevant signal at tops or bottoms of trends, it also is an important alert for gap up trade situations.
Doji Pattern Followed by a Gap Up
“He who ignores discipline despises himself, but whoever heeds
correction gains understanding.”
The
Doji is one of the most informative signals in candlestick analysis. It appears
at many significant points in a trend. In addition to its being a relevant
signal at tops or bottoms of trends, it also is an important alert for gap up
trade situations. An inordinate number of times a Doji will be witnessed prior
to a breakout. The gap movements can occur at the top of a trend, bottom of a
trend, or after a flat trading period.
One
of the trading rules for a Doji is, “the trend will usually move in the direction of how prices open
after a Doji.” The
trend strength becomes more enhanced if the open price gaps away from the Doji.
A Doji followed by a gap usually produces a very strong trend.
The
Japanese Rice traders say, “Always
take heed when a Doji appears.” It
is even more important to take heed when prices gap away from a Doji. That
becomes strong evidence that after a day of indecision, a decision has been
made very forcefully.
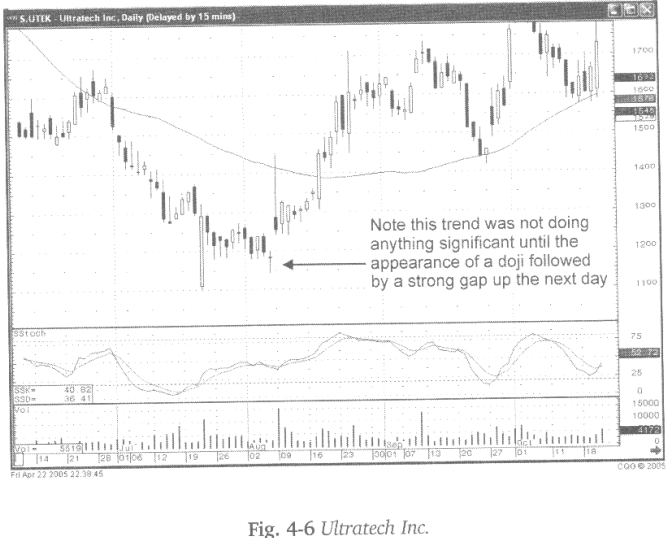
Fig.
4-6, The Ultratech Inc. chart reveals a relatively sloppy trading environment
in late July and early August. Stochastics are in mid-range. Notice the Doji at
the end of that sideways trading is the last signal prior to a definite move to
the upside. Although the gap up trading day did not show strength by the end of
the day, the fact that it gapped up away from the Doji, revealed important
information. For some reason the buyers were coming into the stock with great
strength. They did so the day after an indecision day, the Doji. As observed,
buying pressure continued after that gap up day.
The
gap up day does not necessarily need to show strength after the gap up. As
illustrated in Fig. 4-7, the Devon Energy Corp. chart in January of 2005, the
gap up day finished at the lower end of the trading range. What should be
analyzed is that when the stochastics were in the oversold condition, a
Piercing Pattern appeared. Then a Doji appeared. The gap up in price, after
those signals becomes the relevant parameter for the evaluation. Would it have
been better to see a strong bullish candle after the gap up? Certainly, but the
fact that investors were wanting to buy aggressively the day after the Doji
should be the predominant evaluation.
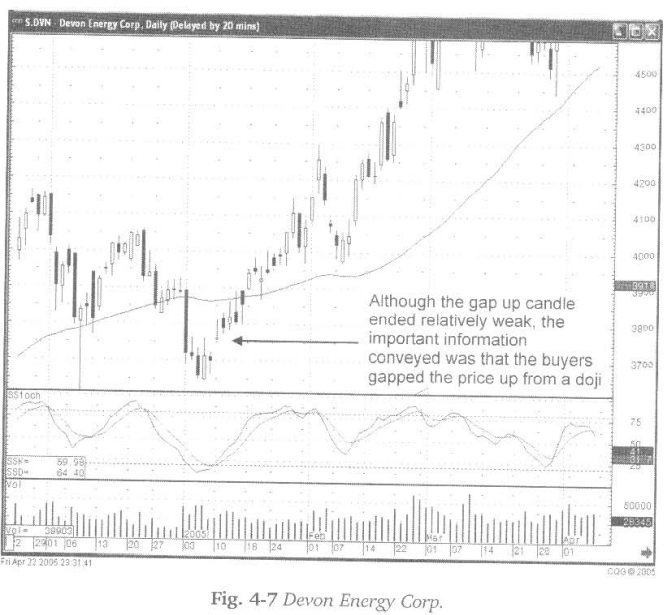
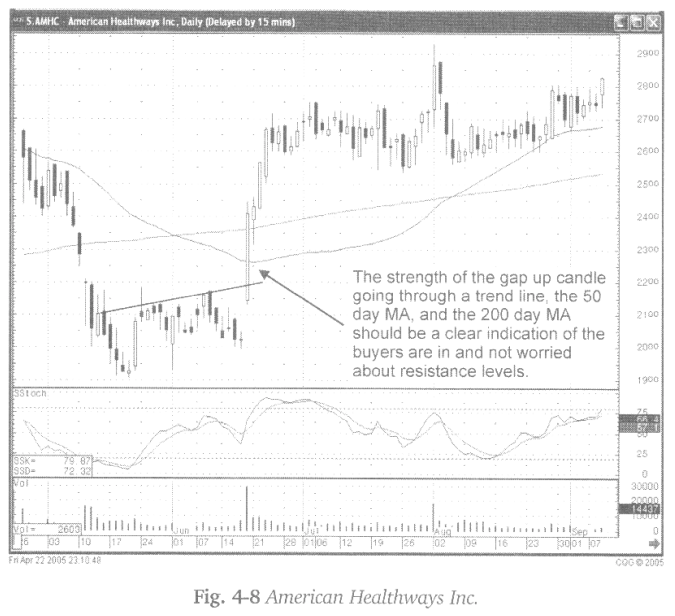
Fig.4-8,
The American Healthways Inc. chart also demonstrates a gap up from a Doji after
a relatively sloppy trading session. The strength of the initial gap up candle,
going through both the 50-day and the 200-day moving average, reveals there
should be more upside potential.
Should
the percent move be a concern? Definitely not! A price-movement, when the
proper signals are present, indicates strength coming into a trend. The message
conveyed by a 5%, 10%, 20%, or greater move may just be the forewarning of a
price movement that can continue up another 30%, 50%, 100%, or greater. Do not
let percentages be a deterring factor. If you’re going to buy with a
candlestick buy signal, then sell when you see a candlestick sell signal.
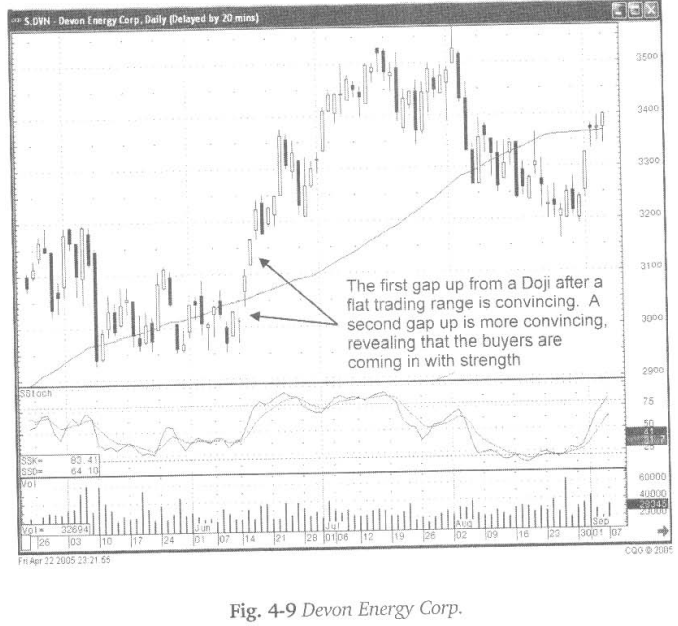
Fig.
4-9, the Devon Energy Corporation chart also illustrates an indecisive trading
period ending with a Doji. The last day of indecision clearly exhibited what
the new decision process was on the following day. The gap up from the Doji,
with trading opening above the 50-day moving average and closing with strength,
provided valuable information. The buyers were stepping in and taking prices
higher. It confirmed that fact again. The following day exhibited another gap
up. If one gap up illustrates strength, two gap ups illustrate that much more
strength.
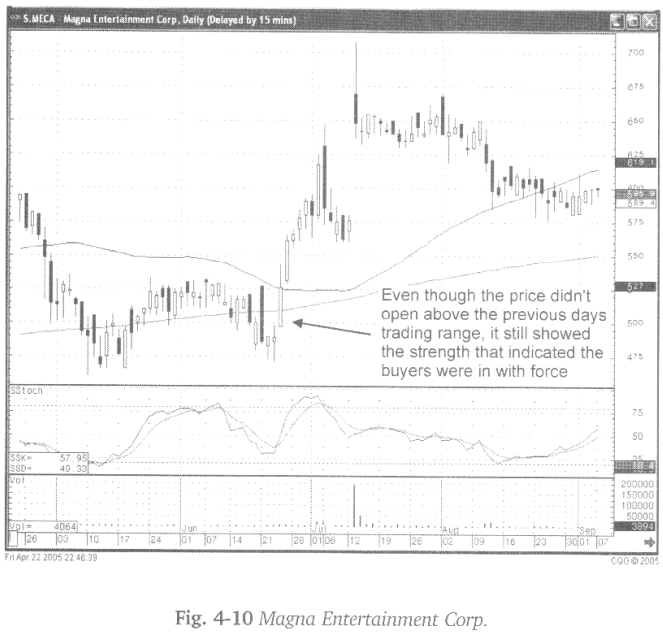
The ‘rules’ for gapping up, after a Doji, do not have to be to
the letter. The indication that the buyers are coming into a position with
strength, opening the price well above the closing price of the Doji day, does
not require the true gap definition. As seen in Fig.
4-10, the Magna Entertainment Corp. chart, the price gapped up the following
day after a Doji/Spinning Top. Although the price did not quite open above the
top of the trading range of the Doji signal, it still indicated that the buyers
had moved the price significantly. Buying continued from that point.
If
there is evidence of strong buying, gapping the price away from the previous
days close, the message should still be the same. The buyers are coming in
with much more strength than what was being traded the previous day.
The
important factor in this scenario is the day of indecision was followed by a
clear statement of what the investors had decided. Analyzing candlestick signals
should be done with a commonsense evaluation, not a stringent set of rules! If
you understand what each signal represents, the investment actions that follow
can be better interpreted.
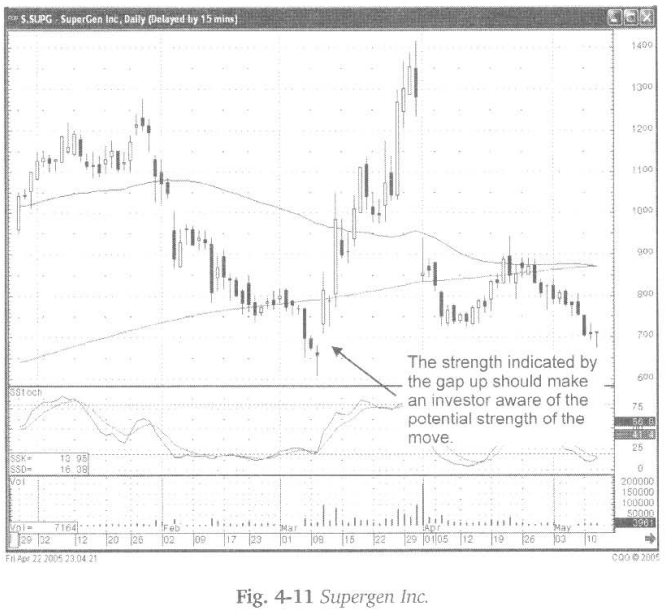
Logically,
interpretation becomes much easier the stronger the indication that the buyers
are coming in with force. As illustrated in Fig.4-11, the SuperGen Inc. chart,
the Doji at the bottom, followed by a large gap up, produces a much easier
evaluation. Stochastics in the oversold area, a gap up from a Doji, and the
price going up through a major moving average, after an extended downtrend,
aligns a number of the stars. These are all parameters for a high probability
trade.
A
strong trading pattern makes sitting through the day after the gap up less
stressful. The strong ‘buy1 signal becomes the predominant investment factor.
Although the selling during the day after a gap up might cause concern, knowing
that a strong buy signal has been created should induce more patience. The
strength of the ‘buy’ signal would allow sitting through the following day without
panicking.
A
large influx of buy orders, after a Doji, should become a clear indicator of
which direction the trend will move. There is an easy method for confirming
this scenario in your own mind. Scan back through charts. As you are going
through the learning process, analyzing the peaks and valleys of price trends
will become highly educational. When you come upon a Doji at the bottom,
followed by a gap up, review what occurred in the trend if prices gapped up the
next day. You’ll discover that an inordinate number of strong rallies were
started with a Doji followed by a gap up.
How To make High Profit In Candlestick Patterns : Chapter 3. High Profits Using Gaps : Tag: Candlestick Pattern Trading, Forex : Candlestick analysis, Doji after gap down, Doji after downtrend, Doji gap up - Doji Followed by a Gap Up