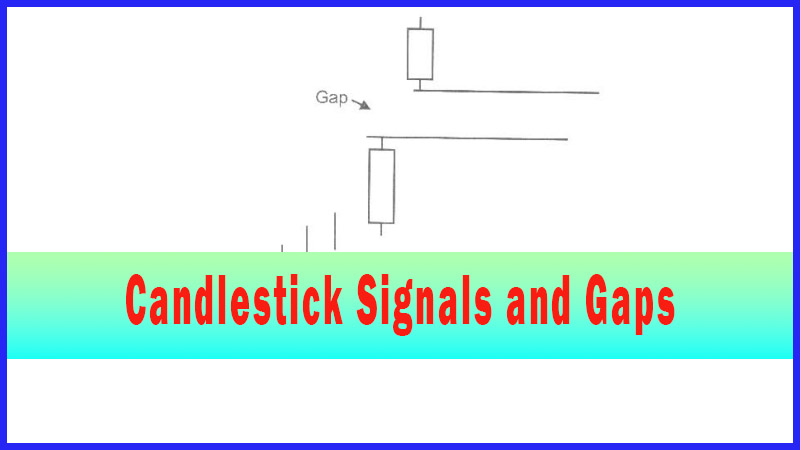
Gaps at the Top
Candlestick analysis, Candlestick chart, Gap down Doji, Hammer signal, Bullish Harami, Gap up bullish candle
Course: [ How To make High Profit In Candlestick Patterns : Chapter 3. High Profits Using Gaps ]

The gap up that appears at the top of an uptrend is the one that provides ominous information. Remembering the mental state of most investors, the enthusiasm builds as the trend continues over a period of time.
Gaps at the Top Candlestick Charts
“New knowledge is the most valuable commodity on earth. The more
truth we have to work with, the richer we become.”
The
gap up that appears at the top of an uptrend is the one that provides ominous
information. Remembering the mental state of most investors, the enthusiasm
builds as the trend continues over a period of time. Each day the price
continues up, the greater investors become convinced the price is going to go
through the roof. The “talking
heads” on
the financial news stations start to show their prowess. They come up with a
multitude of reasons why the price had already moved and will continue to move
into the rosy future. With all this enthusiasm around, the stock price gaps up.
Unfortunately, this is usually the top. Fortunately, Candlestick investors
recognize it. They can put on exit strategies that will capture a good portion
of the price move at the top. Consider the different possibilities that can
happen when witnessing the gap up at the top of a sustained uptrend. Most of
the time, the gap will represent the exhaustion of the trend, thus called an
Exhaustion Gap. Or it could be the start of a Three Rising Windows formation,
or big news such as a buy out or a huge contract announcement about to be
announced.
What
are the best ways to participate in any potential of higher prices, at the same
time knowing that the probabilities are that the top is near? A few simple
stop-loss procedures can allow you to comfortably let the price move and
benefit from the maximum potential.
Hopefully,
after a gap up is occurring, (the exuberance of an extended trend), a
substantial gain is already realized in the position. The gap up is adding to
an already big gain. Probabilities dictate that this is the top. However, there
is the possibility of more gains.
Upon
a slight to medium gap up, the Candlestick investor should put their stop at
the close of the previous day. The thinking being that if the price gapped up
in overbought conditions, and prices came back down through the close of the
previous day, the buying was not sustained. If so, the ‘stop’ closed the position
at the level of the highest closing price of that trend. The same rationale
applied to the psychology of a gap down at a bottom of a trend can be applied
equally well to the gap up at the top of a trend. Where do most investors buy?
They buy when the confidence has finally built up, after the price has done
well. When most investors feel safe that a price is doing well, that is usually
the time to look for ‘sell’ signals.
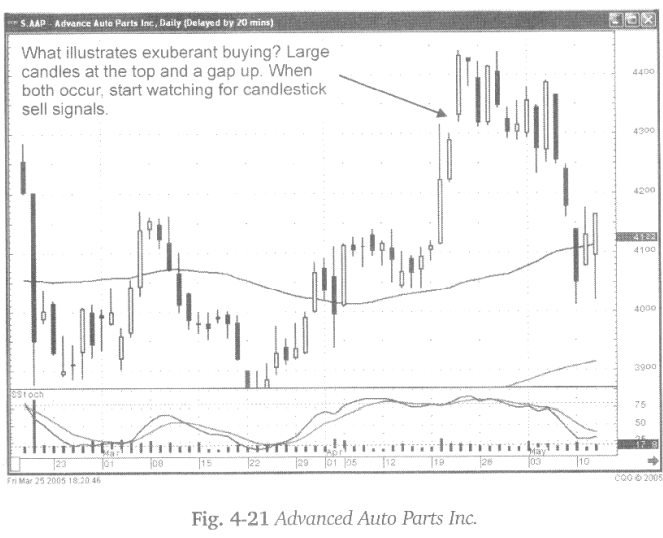
The
gap up after a strong run up is dearly indicative of the exuberant buying. When
buying gets exuberant, the smart-money starts taking profits. Fig, 4-21, The
Advanced Auto Parts Inc. chart, reveals the exuberance. Large candles, in the
overbought stochastics conditions, reveal that investors are piling into the
stock. Finally a gap up becomes the first signal that the top may be near. This
becomes more evident the following day when a Harami/Hanging Man signal
appeared. Now there is the evidence of a gap up followed by a potential
candlestick “sell” signal. The lower open the following day makes it more
convincing that the top is here. Does a gap up at the top necessarily mean the
ultimate top has occurred? Definitely not, however it produces a good
indication that a top may be very near. It provides the investor with an alert
to be ready to take profits and/or start shorting a position on the first signs
of weakness.
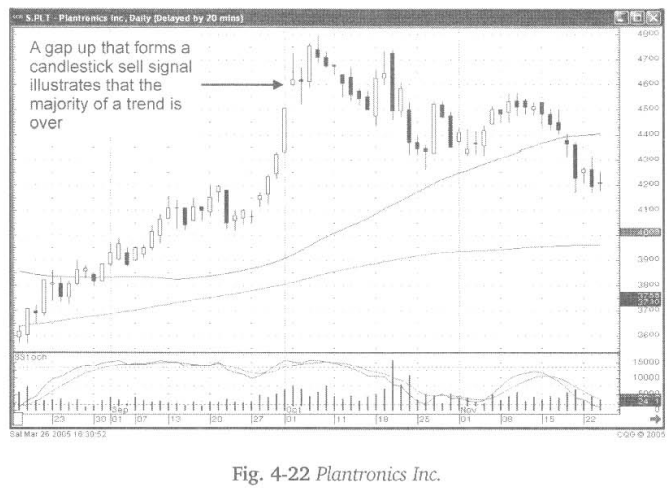
Fig.
4-22, The Plantronics Inc. chart shows a Shooting Star after a gap up. The
Shooting Star at the top of a trend alone would signify that the bears are making
their presence known. The fact that it occurred after a gap up is more
convincing. Exit strategies can be better formulated when knowing the probabilities
indicate a reversal is occurring or about to occur. Each investor can prepare
exit strategies that comfortably fit their investment nature. For example,
upon seeing weakness the following day after the shooting star, half the
position may have been closed out. The other half might have been closed out
two or three days later as more candlestick sell signals appeared. A gap up at
the top has historical indications that the majority of the uptrend is over.
Having that knowledge allows an investor to better analyze and shift funds
from a poor probability situation back into a high probability situation.
How To make High Profit In Candlestick Patterns : Chapter 3. High Profits Using Gaps : Tag: Candlestick Pattern Trading, Forex : Candlestick analysis, Candlestick chart, Gap down Doji, Hammer signal, Bullish Harami, Gap up bullish candle - Gaps at the Top