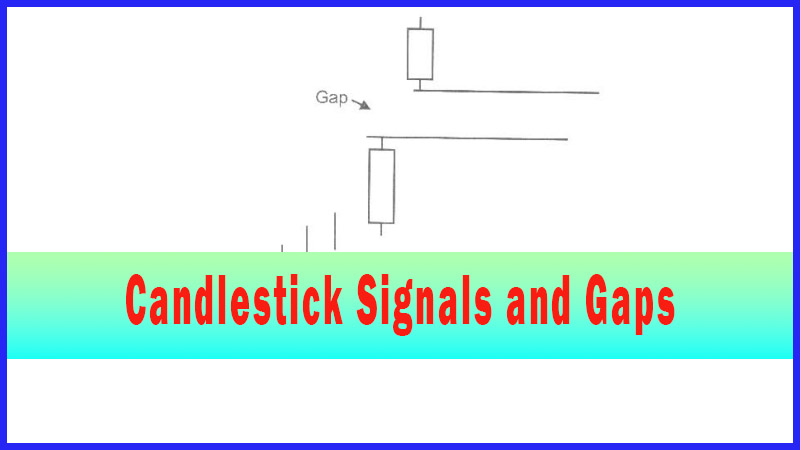
Hammers, Haramis, and Inverted Hammers with Gaps Up
Hammers, Haramis, Inverted Hammers, Gaps Up, Candlestick signal
Course: [ How To make High Profit In Candlestick Patterns : Chapter 3. High Profits Using Gaps ]

the Doji illustrates indecision and creates a high-powered move followed by a gap up, do not disregard that same effect following the other major candlestick buy signals at the bottom. The Hammer, Harami, and the inverted Hammer signify a potential reversal when seen in the oversold condition.
Hammers,
Haramis, and Inverted Hammers with Gaps Up
“If you are on the right track, if you have this inner
knowledge, then nobody can turn you off no matter what they say.”
Although
the Doji illustrates indecision and creates a high-powered move followed by a
gap up, do not disregard that same effect following the other major candlestick
buy signals at the bottom. The Hammer, Harami, and the inverted Hammer signify
a potential reversal when seen in the oversold condition. Confirmation of a
reversal requires positive trading the following day. As with the Doji,
positive trading represented with a gap up is that much more compelling
evidence that the reversal has occurred. The force with which that new trend
may move is demonstrated by the gap up in price the following day.
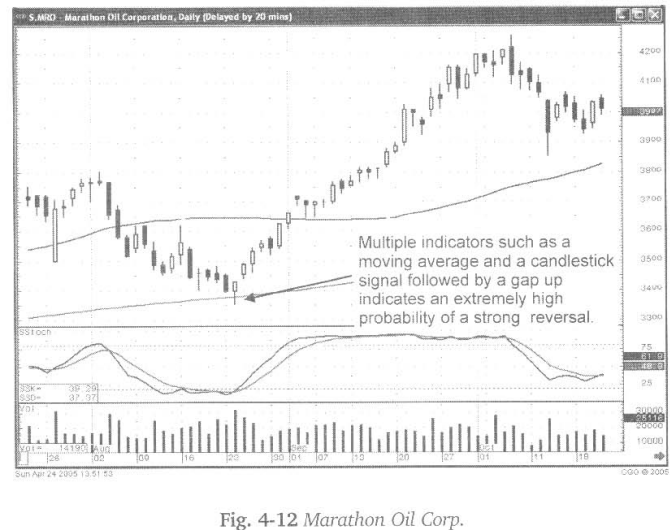
The
candlestick signal is the alert that a potential change of investor sentiment
may be occurring, especially when it occurs in oversold condition. As illustrated
in Fig.4-12, the Marathon Oil Corp. chart, the Hammer/Harami signal gave a good
indication that the 200-day moving average should act as support. This becomes
better confirmed the following day when the price gaps up. It becomes more
obvious that the 200-day moving average acted as the support when buyers showed
great zeal to get into this position, causing the next day’s gap up.
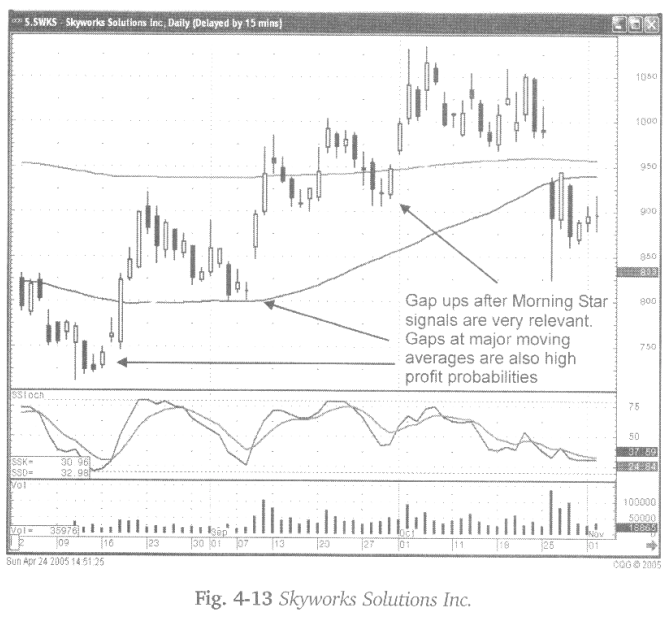
Being
able to use a visual analysis makes interpreting investor sentiment at
important levels very easy. Utilizing the knowledge of what the signal conveys
and what a gap up conveys enhances strong trend identification.
How To make High Profit In Candlestick Patterns : Chapter 3. High Profits Using Gaps : Tag: Candlestick Pattern Trading, Forex : Hammers, Haramis, Inverted Hammers, Gaps Up, Candlestick signal - Hammers, Haramis, and Inverted Hammers with Gaps Up