Gap Down at the Bottom
Candlestick analysis, Candlestick chart, Gap down Doji, Hammer signal, Bullish Harami, Gap up bullish candle
Course: [ How To make High Profit In Candlestick Patterns : Chapter 3. High Profits Using Gaps ]
The basic premise of investing: buying at the bottom. Candlestick analysis provides the tools for exploiting human emotions. The fear that enters most investors investment decisions can usually be seen graphically on a candlestick chart.
A Gap Down at the Bottom
The
basic premise of investing: buying at the bottom. Candlestick analysis provides
the tools for exploiting human emotions. The fear that enters most investors
investment decisions can usually be seen graphically on a candlestick chart.
The evidence is usually illustrated with the candle bodies getting larger as
the price enters into the oversold conditions. This is often seen after an
extended decline. The further the downtrend moves, the more panic selling is
observed.
The
panic selling is usually fueled by the rhetoric put out by the talking heads on
the financial news stations or the financial publications. Most of the time the
financial news agencies are reporting what has already happened. After a stock
or any other trading entity has been in an extended decline, it starts getting
discussed in the news media. The discussion for why that industry/sector is in
such bad condition starts getting publicized, alter it has been in a
three-month downtrend.
Quite
often when a trend, whether positive or negative, becomes recognized by the
financial news repotting media, that is usually time to start watching for
reversal signals. Very rarely will you see reports from the news media stating
why an industry would likely be attractive after a severe decline. They always
seem to report why things are bad after the price decline has occurred. This
becomes a great indicator for watching for a candlestick reversal situation.
When you hear constant doom and gloom predictions for an industry; prepare for
the panic selling. Then start watching for the buy signals.
“An investment in knowledge always pays the best interest.”
What
is the ultimate indicator of the panic selling? The gap down at the bottom! A
clear indication, illustrating investors wanting to get out of a position, no
matter what the price! The gap down illustrates the tremendous desire (panic)
to exit from that position. A gap down in oversold conditions becomes the cause
for diligently watching for a candlestick ‘buy” signal to occur. If most
investors panic at the bottom and a gap down represents the panic selling, then
the bottom is usually very nearby. This is purely common sense. Having this
knowledge of investor psychology allows the candlestick investor to be
prepared for the “buy” signal.
Does
that mean a buy signal will show up immediately? Not necessarily. However it
does indicate that the majority of the move in the downtrend is probably over.
This creates two benefits. First, if this position had been shotted, it now
reveals a time to start covering the short position. Second, it alerts in
investor to start watching for a buy signal.
As
illustrated in Fig. 4-14 the Powerwave Technologies Inc. chart, after an extended
downtrend the selling starts escalating. This is identified with a large black
candle followed by a gap down in price. That gap down forms a Doji/ Spinning
Top. With the stochastics well in the oversold condition, the gap down should
have been the first inkling that the bottom was near. In the Powerwave
Technologies Inc. chart, the gap down Doji was the end of the majority of the
downside move. About a week later, a gap up after the Hammer signal indicated
the uptrend may have started.
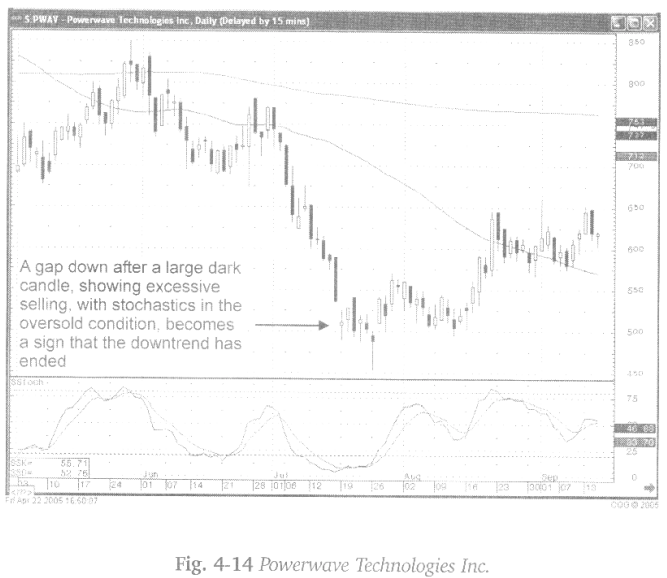
The
point of this illustration is to show that the gap down at the bottom warranted
closing the short positions and watching to go long.
As
witnessed in Fig. 4-15. the Raymond James Financial Inc. chart, the stochastics
had indicated that the price of the stock was in the oversold condition throughout
early July until early August. During that time there were a number of potential
candlestick buy signals but the signals never got confirmed. Note how the
ultimate bottom occurred after a gap down.
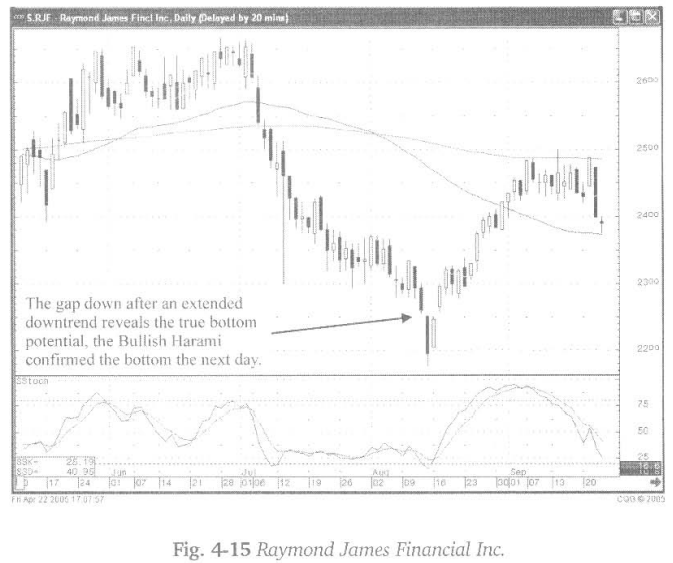
A
big selling day, after a gap down when stochastics have been in the oversold
condition for a lengthy period of time, becomes the alert to start watching for
a candlestick buy signal. The Bullish Harami, the following day becomes a clear
indication that the last gasp selling was over and buying was starting. A gap
up the following day creating an island reversal, becomes a very strong
reversal indicator. This whole sequence would have been put on watch because of
the gap down.
Fig.
4-16, the Monster Worldwide Inc. chart, also illustrates the final bottom. It
is not unusual to see increased volume coming into trading after a gap down.
This becomes an indication that the weak are selling to the strong. Although
the volume is not a necessity, the presence of a large volume day during the
gap- down day, or a day or two to one side or the other, reveals that there has
been a large change of ownership in a stock. The weak sellers have relinquished
their stock to the strong.
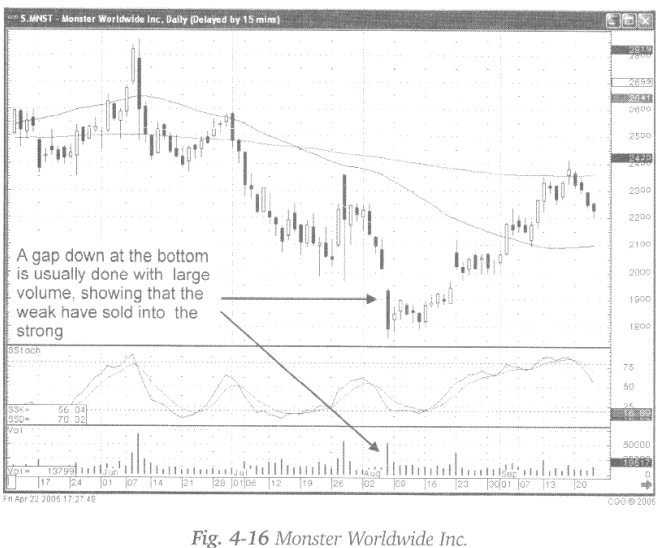
The
Spinning Top/Harami appearing during following day illustrates that the selling
had stopped. The uptrend may not start immediately. There always exists the
possibility of some follow-through selling from the previous downtrend.
However, a gap down signifies that most of the selling occurred that day. After
a few days, the rest of the selling becomes acquired by the buyers. Then the
trend can get started to the upside.
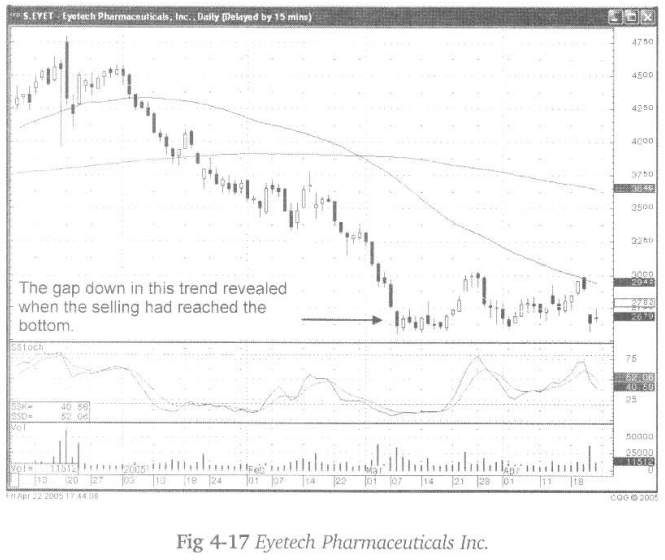
The
gap down at the bottom doesn’t necessarily mean that a strong uptrend will
occur, but it does signify that the downtrend has stopped. Fig. 4-17, The
Eyetech Pharmaceuticals Inc. chart illustrates, after an extended downtrend,
the gap down at the bottom revealed that the downtrend had stopped. At that
point, watching for candlestick ‘buy signals becomes the strategy. Those ‘buy1
signals may not show up for a few weeks, but the probabilities that the bottom
is near becomes extremely great when witnessing the gap down in the oversold
conditions. This may not be the time to buy. However, if an investor had been
short this position, the gap down would have been the signal to take profits.
Keep
in mind, a gap down near the oversold area indicates that a bottom is near.
That is why it becomes important to analyze the candlestick signals that are
forming.
As
in the case of Fig. 4-18, Sonic Solutions Inc., the gap down on large volume
was near the bottom. It took a few more days to wash out all the sellers.
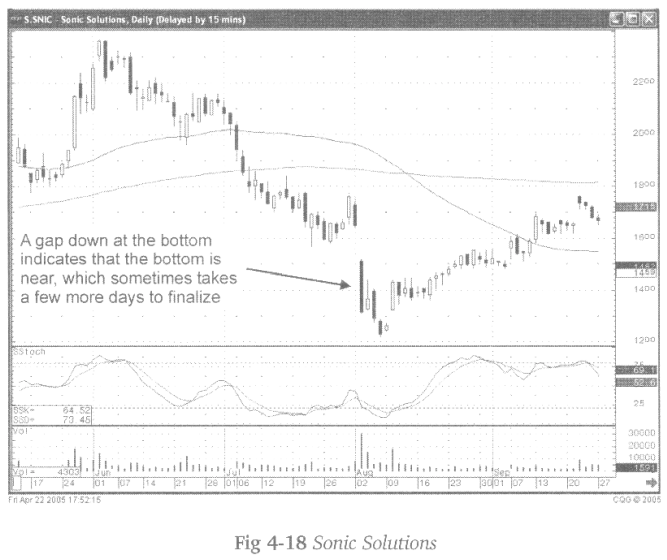
The
Doji/Harami, followed by the gap up bullish candle, became a ‘buy" signal.
After an extended downtrend, all the selling sentiment will not disappear on
one major down day. Likewise, the selling doesn’t always immediately disappear
after a strong bullish candlestick ‘buy’ signal. This knowledge permits a
candlestick investor to sit through a residue selling day or two after seeing a
reversal situation occur.
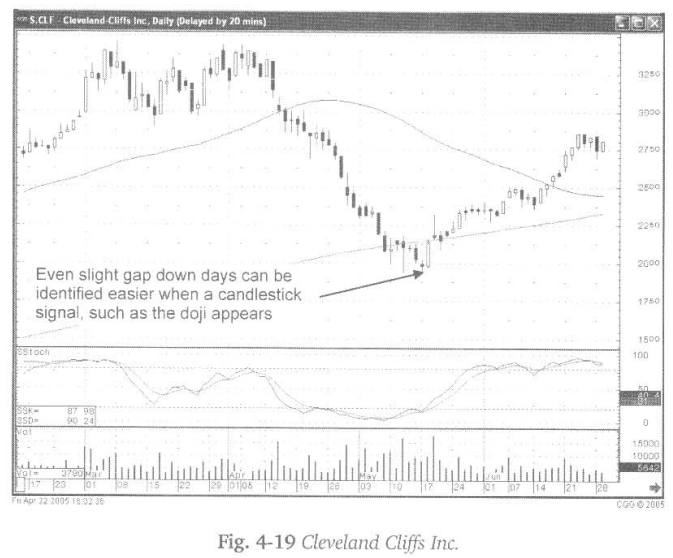
The
subtle gap downs become more apparent when a candlestick signal forms on the
gap down day. Notice in Gig. 4-19, the Cleveland Cliffs Inc. chart how the gap
down may not have been noticed had a Doji not formed that day. Of course, a
Doji at the bottom should always be heeded. When the stochastics have confirmed
the oversold condition, the slight gap down on the open of the Doji signal
becomes more important.
A
gap down on big volume should become a well-recognized sign. It incorporates
all the investor psychology required for identifying when investors are getting
out at the bottom. It usually occurs on bad news. That news probably was known
to the smart investors months before. More titan likely they were selling at
the top. The information was built into the decline of that stock price months
ahead of when the announcement came out.
Fundamental
analysis should be used when exploiting the gap down at the bottom. Whatever
bad news was reported, fundamental analysis assumes that the management of the
company was aware of the problem well before it was announced. It also has to
be assumed that a high percentage of management teams are relatively smart and
effective
This
assumption is made based upon the fact that most management executives rise to
their positions based upon talent. With that in mind, then it can be is assumed
that by the time that a bad news announcement is made, the problem is being
resolved. The management of that company had been working on the solution to
the problem for at least a few months. By the time the news comes out, a
resolution to the problem may already be in place.
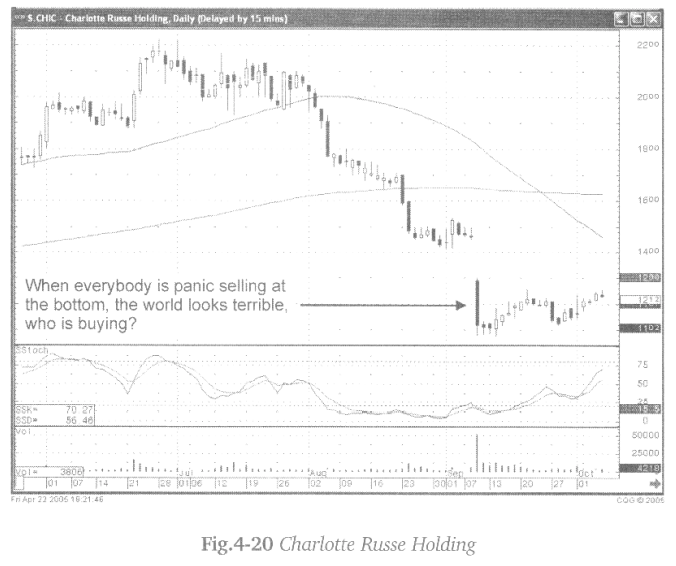
That
leads to one final question. If everybody is panic selling at the bottom, and
the circumstances looks bleak for that stock, then who is buying? If you have
ever found yourself selling at the bottoms because your emotions cannot stand
the stress and the strain, then you should recognize where you sold in the
past. Use that knowledge and the understanding of what a gap down at the bottom
represents. Once you can visually identify indications of bottoming action, an
investor can now establish being mentally prepared to buy when the rest of the
world seems to be selling.
How To make High Profit In Candlestick Patterns : Chapter 3. High Profits Using Gaps : Tag: Candlestick Pattern Trading, Forex : Candlestick analysis, Candlestick chart, Gap down Doji, Hammer signal, Bullish Harami, Gap up bullish candle - Gap Down at the Bottom


