Deep Wave (b) of Wave (iii)
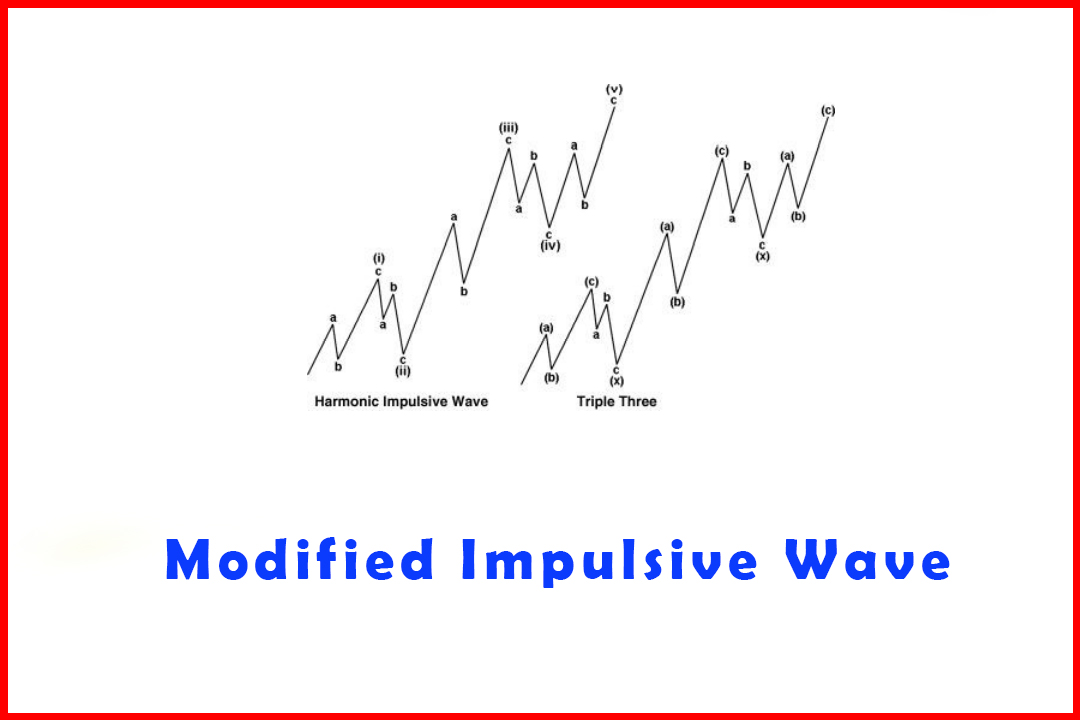
Modified Impulsive Wave, Triple Three Trading Strategy
Course: [ Harmonic Elliott Wave : Chapter 3. Impulsive Wave Modification ]
Elliott Wave | Forex |
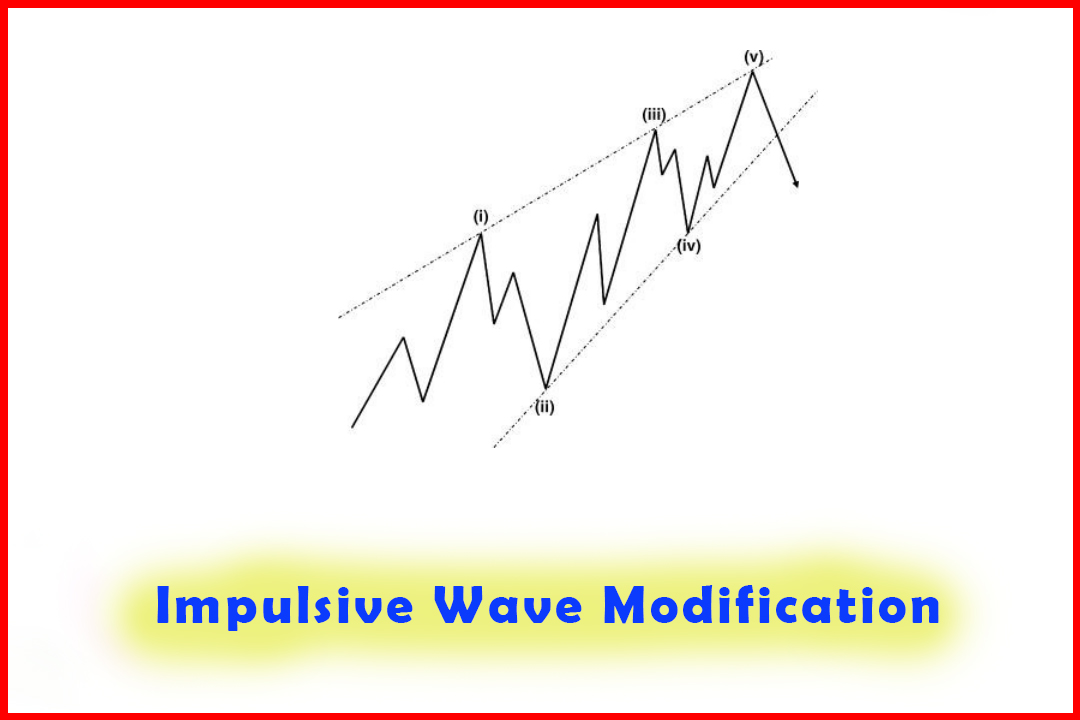
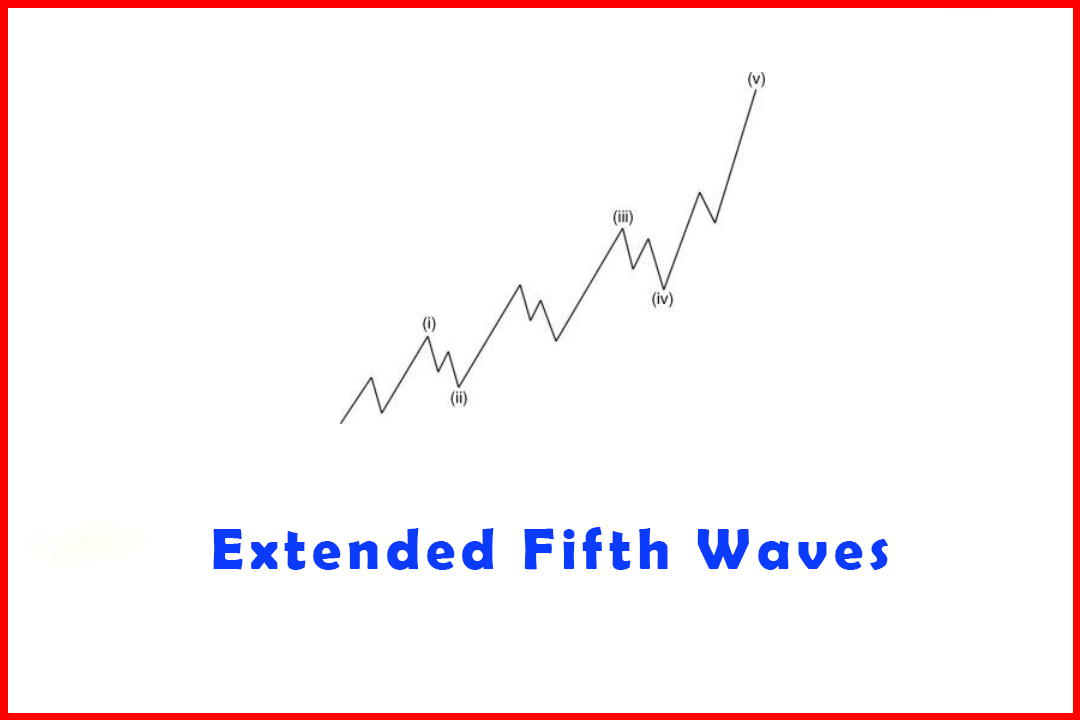
This type of alternation is what we have come to expect from Elliott's guideline. The added complication comes from the fact that Wave (iii) develops in three waves.
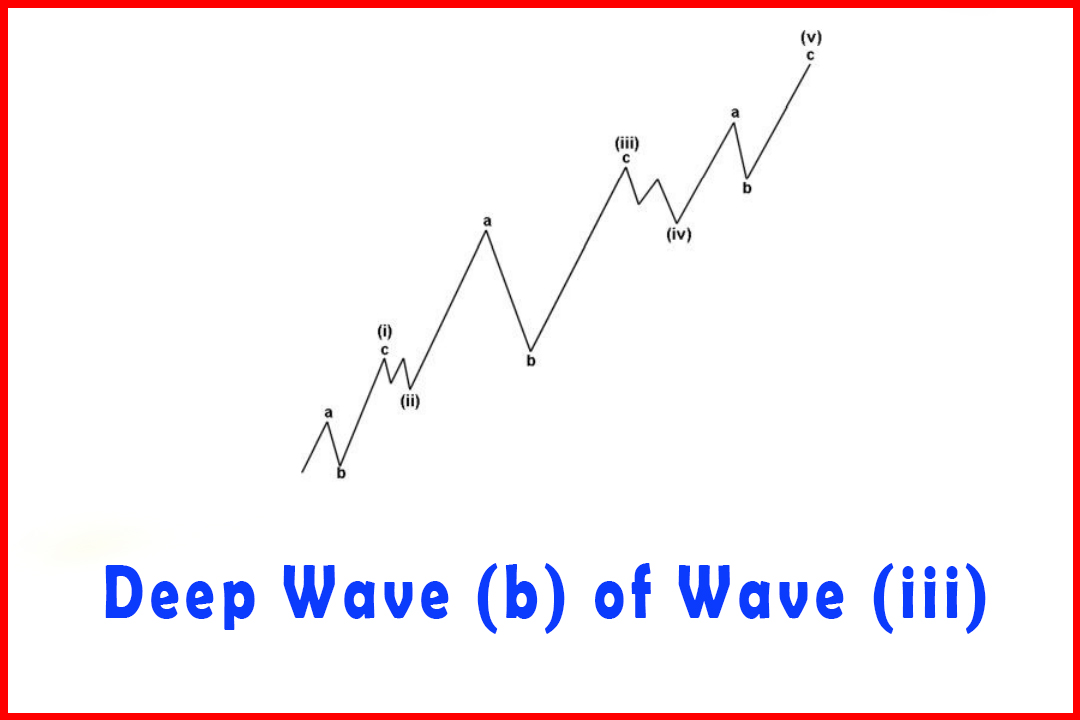
Deep Wave (b) of Wave (iii)
This
type of alternation is what we have come to expect from Elliott's
guideline. The added complication comes from the fact that Wave (iii) develops
in three waves. Contrary to the widely held belief that Wave 3 is normally the
most aggressive wave, and in a strong trend this does remain the same even in
the modified structure, I have found that in some instances Wave (b) of Wave
(iii) can retrace very deeply, as shown in Figure 3.20.
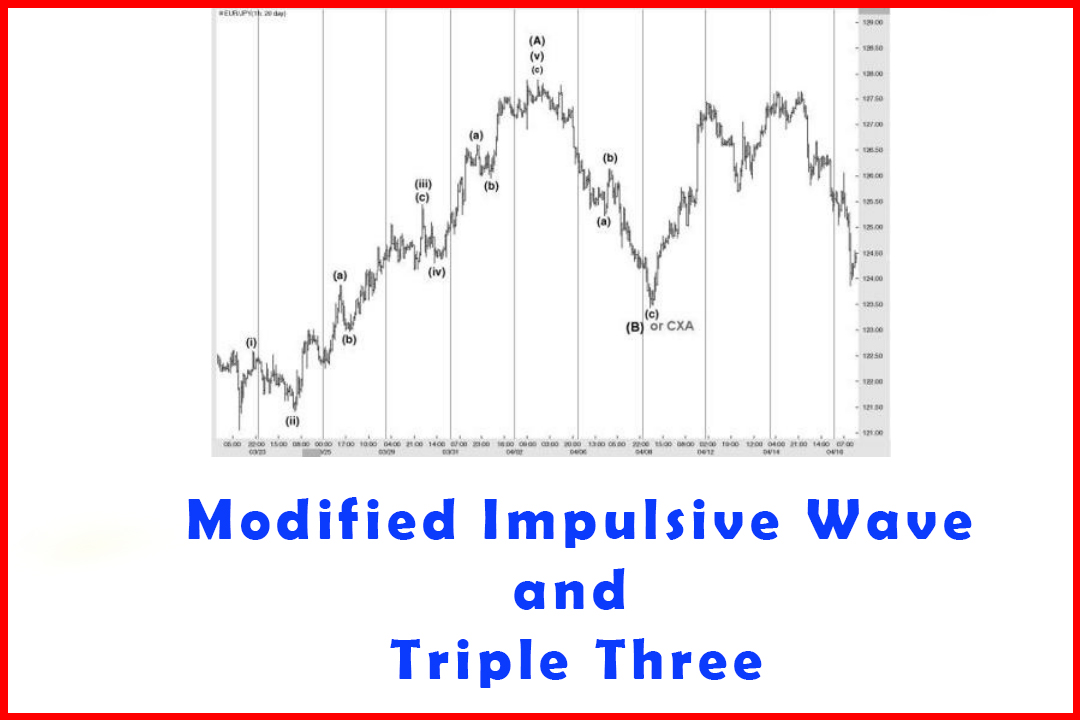
Figure 3.20
Shallow Wave (ii) and Wave (iv) but a Deep Wave b of Wave (iii)
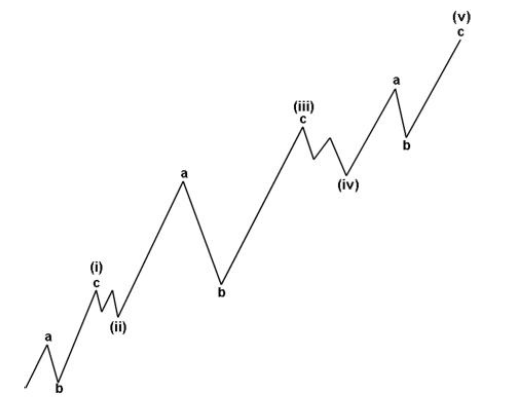
This
particular version of alternation doesn't occur that frequently. In
foreign exchange, for example, I note this tends to occur more frequently in
JPY crosses such as EURJPY and GBPJPY where there are clearly trades being made
in the two individual currency pairs that make up the cross as well as the
trades in the cross itself.
At
first glance it may actually look as if price has rallied to Wave a in a five-
wave move and is casually counted as a Wave (a). However, the key to confirming
this type of move is in the wave relationships. Clearly Wave (iii) must be a
projection of Wave (i) and also a projection of Wave c in Wave (iii). To
confirm this, the completion in Wave (v) must also be a projection of the
distance from the beginning of Wave (i) to the end of Wave (iii) and projected
from the extreme in Wave (iv).
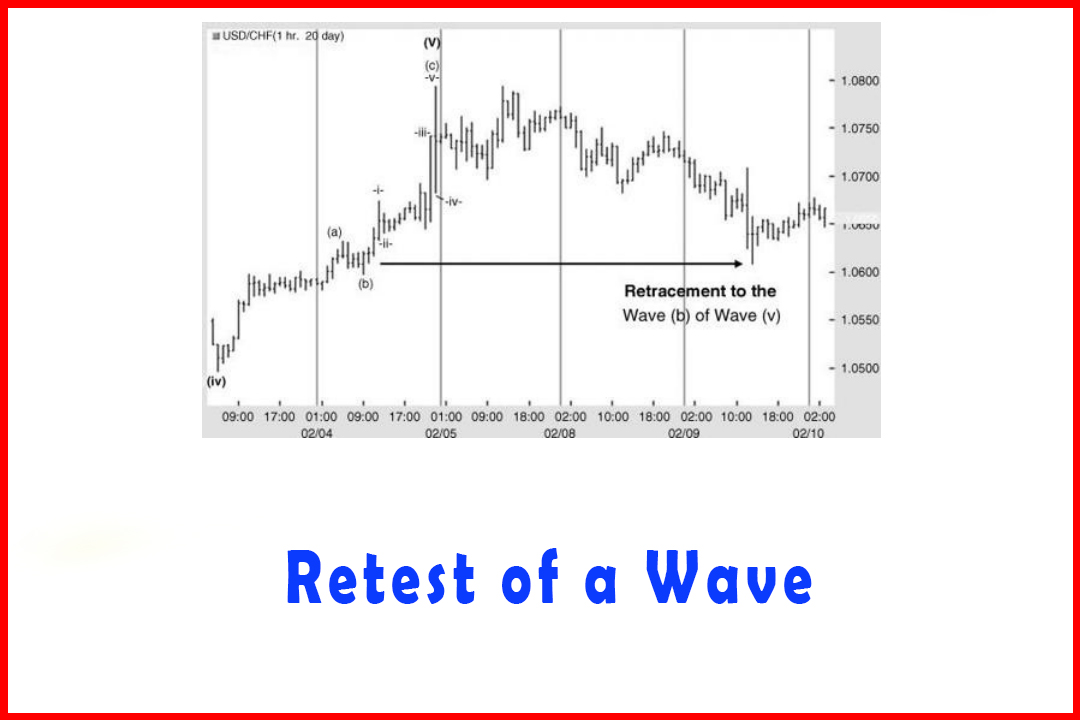
Figure
3.21 displays an example of a deep Wave -b-wave within a Wave -iii- rally which
occurred as I was preparing this section. I will detail the measurements in
Chapter 4, which details examples of the type of wave development that can be
seen and supports these with wave relationships to confirm their validity.
However, suffice it to mention at this point that the relationship of Wave
-c-to Wave -a-was not only very accurate but also matched with a projection in
Wave -iii-.
Figure 3.21 Deep
Wave -b-within Wave -iii-of Wave (C) Higher in USDCHF
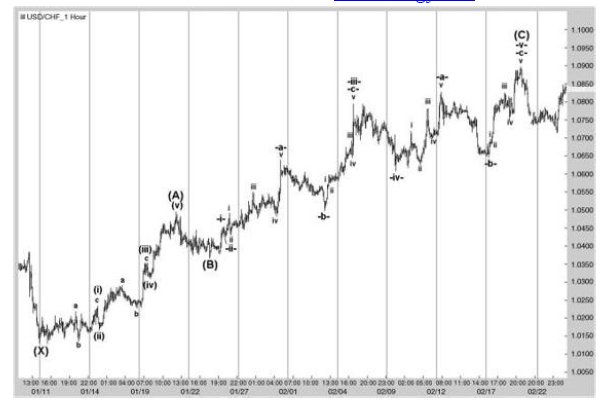
The
three waves in Wave -i-are simple to recognize but it was the Wave -iii- that
became very complicated. In these cases it is almost impossible to forecast how
the wave will develop, and only by taking detailed measurements did I actually
confirm that a five-wave decline did in fact occur. A series of potential
target projections can be generated from the prior wave and it is then
necessary to ensure that the wave developed with a structure relevant for its
position.
The
fact that Wave -ii-was quite shallow and brief would raise the potential for a
more complex Wave -iii-due to the guideline of alternation. That is, we would
know that alternation could provide a deep Wave -b-. Again, having seen Wave -
i-and Wave -ii-complete, we could generate a series of potential targets in
Wave -iii-and keep in mind the targets for Wave (A).
Figure
3.22 displays the rally in Wave -a-of Wave -v-in USDCHF shown in Figure 3.21.
as an example of how alternation can occur in a different way.
Figure 3.22
Shallow Wave b Following a Deep Wave ii within Wave -a-Higher
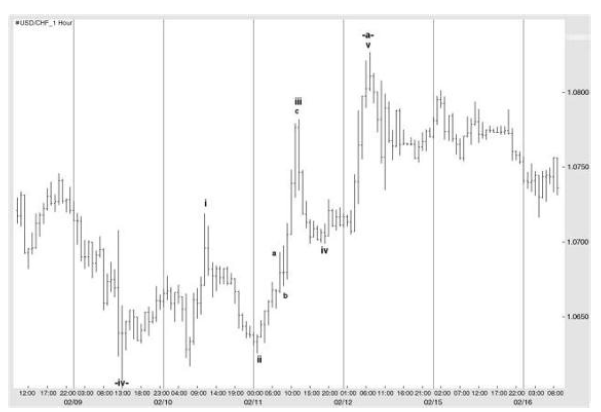
It
can be seen that Wave i developed in three waves and was followed by a very
deep Wave ii that ended just above the Wave b of Wave i. In the subsequent
follow-through higher in Wave iii we can note a very brief and shallow Wave b.
This offers an example of how a deep Wave ii can generate a brief pullback in
Wave b of Wave iii. Interestingly, the Wave iv was also very deep, even
overlapping with the peak in Wave i. However, once again, all the wave relationships
followed normal ratios and offered targets for Wave iii and Wave v.
Again,
I shall include this example when providing greater detail of using ratios in
Chapter 4.
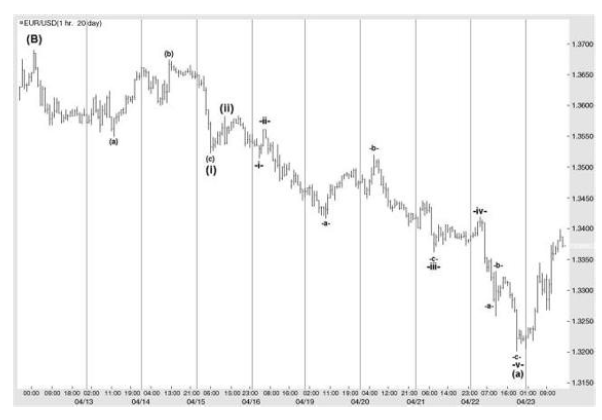
Another
example of a deep Wave (b) is shown in Figure 3.23, which also provided earlier
an example of an extended wave. This correction was a quite steep 61.8%, but
did then provide the same target as the projection in Wave (iii). Equally, both
Wave (ii) and Wave (iv) were limited.
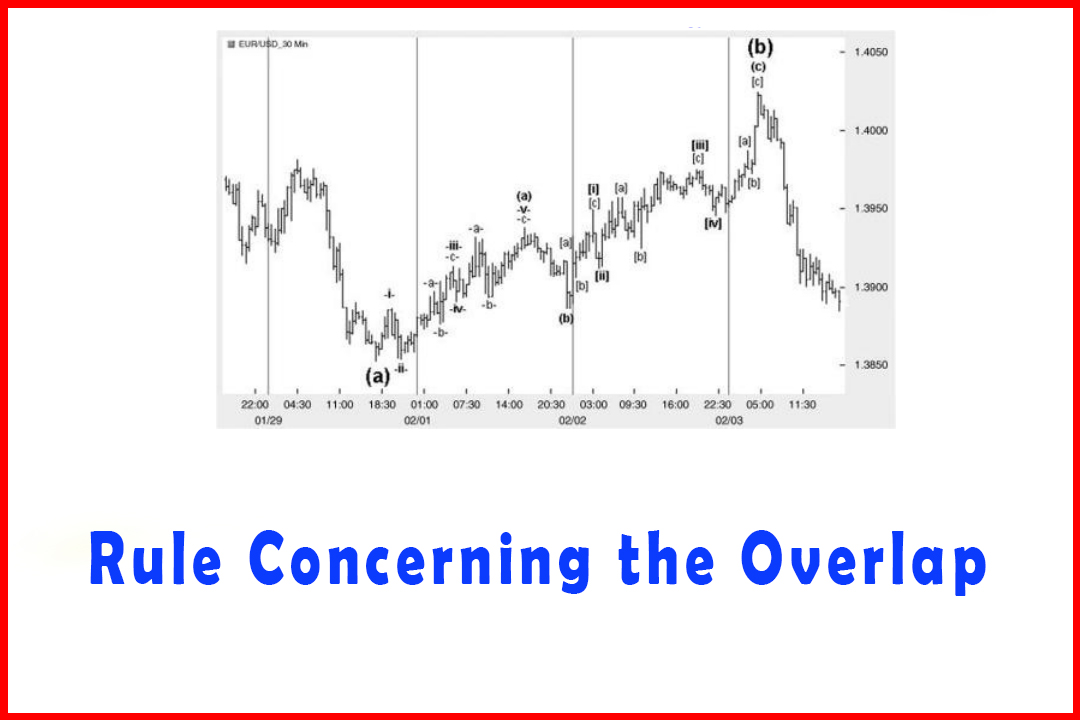
Figure 3.23 A
Five-Wave Decline in Hourly EURUSD with a Deep Wave (b) in Wave (iii)
Harmonic Elliott Wave : Chapter 3. Impulsive Wave Modification : Tag: Elliott Wave, Forex : Modified Impulsive Wave, Triple Three Trading Strategy - Deep Wave (b) of Wave (iii)
Elliott Wave | Forex |