Viewing Waves Without Making Measurements
How to View Waves, How to draw waves, Fibonacci Trading Strategy, Harmonic ratios
Course: [ Harmonic Elliott Wave : Chapter 3. Impulsive Wave Modification ]
Elliott Wave | Forex |
Many Elliotticians I speak to tend to comment that they don't follow Elliott Wave intensely but do observe wave development by eyeballing the chart to identify three-wave or five-wave sequences. However, this methodology can lead to quite misleading forecasts and expectations.
Viewing Waves Without Making Measurements
Many
Elliotticians I speak to tend to comment that they don't follow
Elliott Wave intensely but do observe wave development by eyeballing the chart
to identify three-wave or five-wave sequences. However, this methodology can
lead to quite misleading forecasts and expectations.
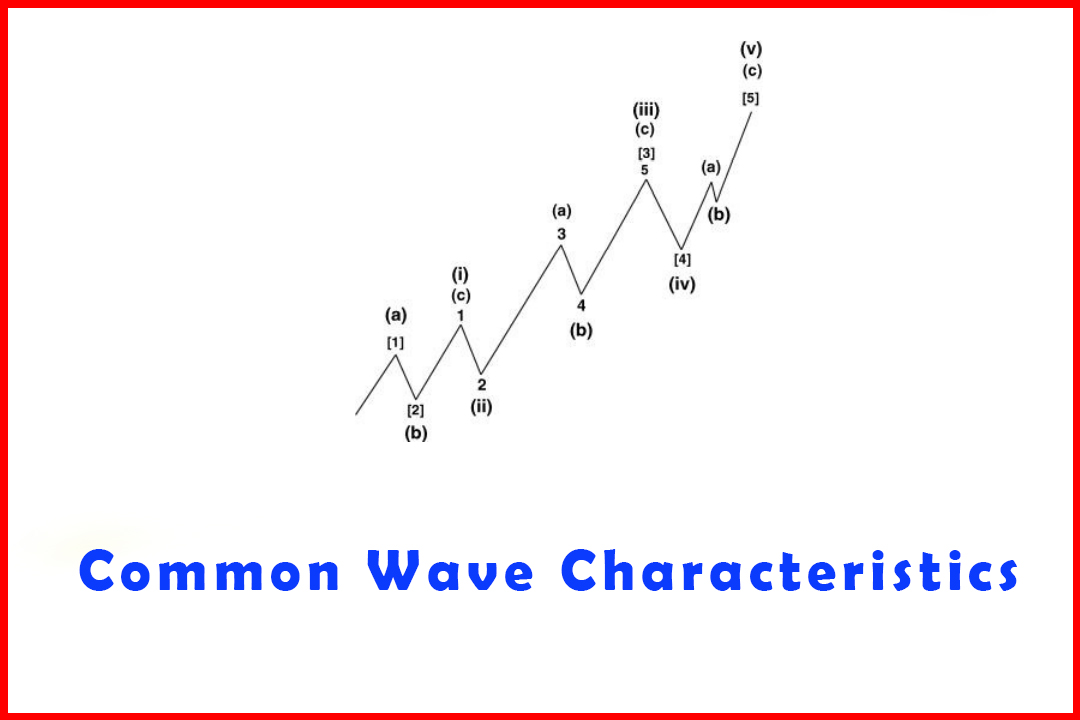
In
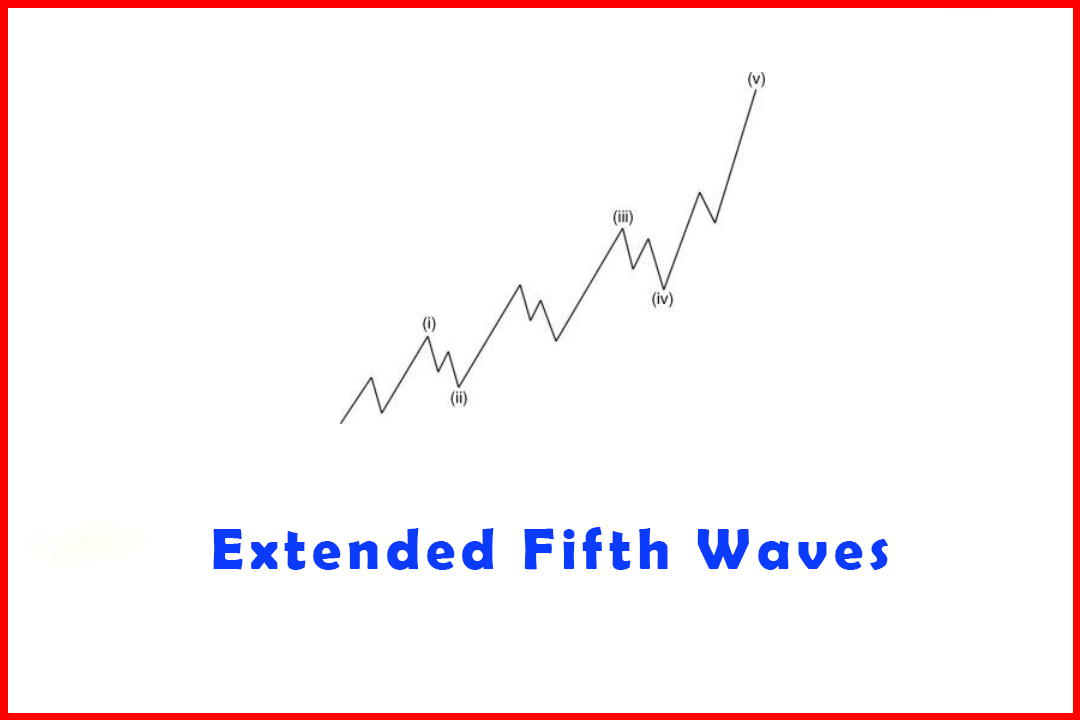
Elliott's structure a five-wave move will imply that price has
completed one of Wave 1, Wave 3, Wave 5, Wave A, or Wave C. These all have
different implications for what we expect the next development to be:
- Wave 1: A correction in Wave 2 of between 14.6% and 100% followed by Wave 3.
- Wave 3: A correction in Wave 4 of between 14.6% and 50% followed by Wave 5.
- Wave 5: A complete reversal and correction to that five-wave move.
- Wave A: A correction in Wave B of between 14.6% and 100% followed by Wave C.
- Wave C: A correction in Wave X or the resumption of an impulsive wave in the next higher degree.
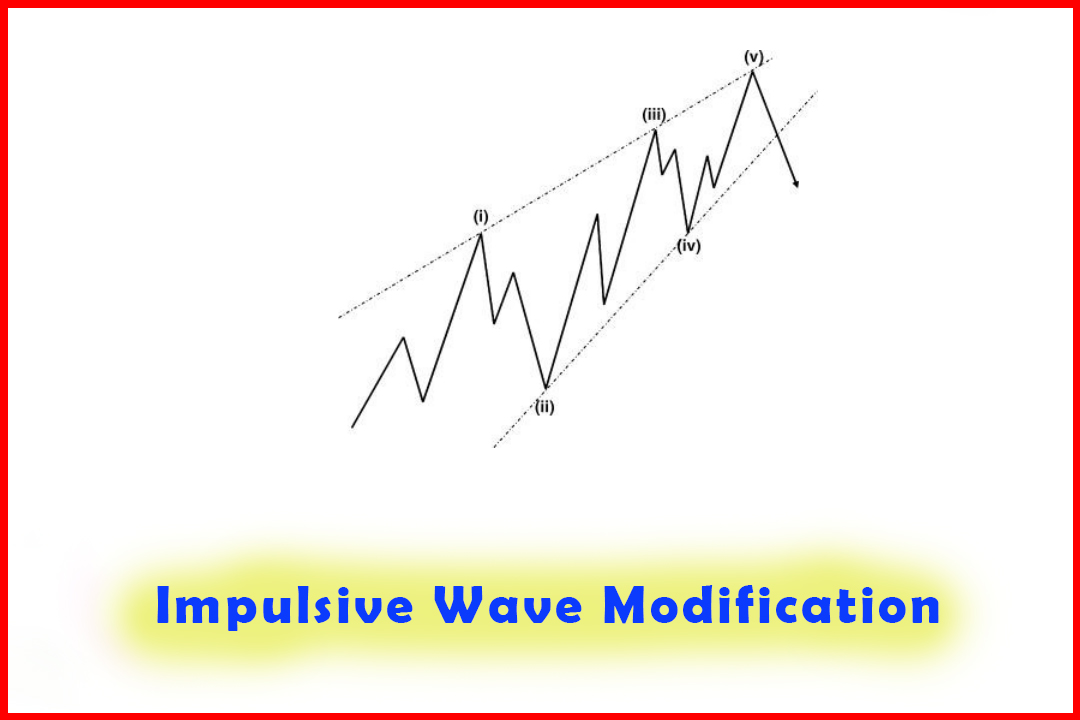
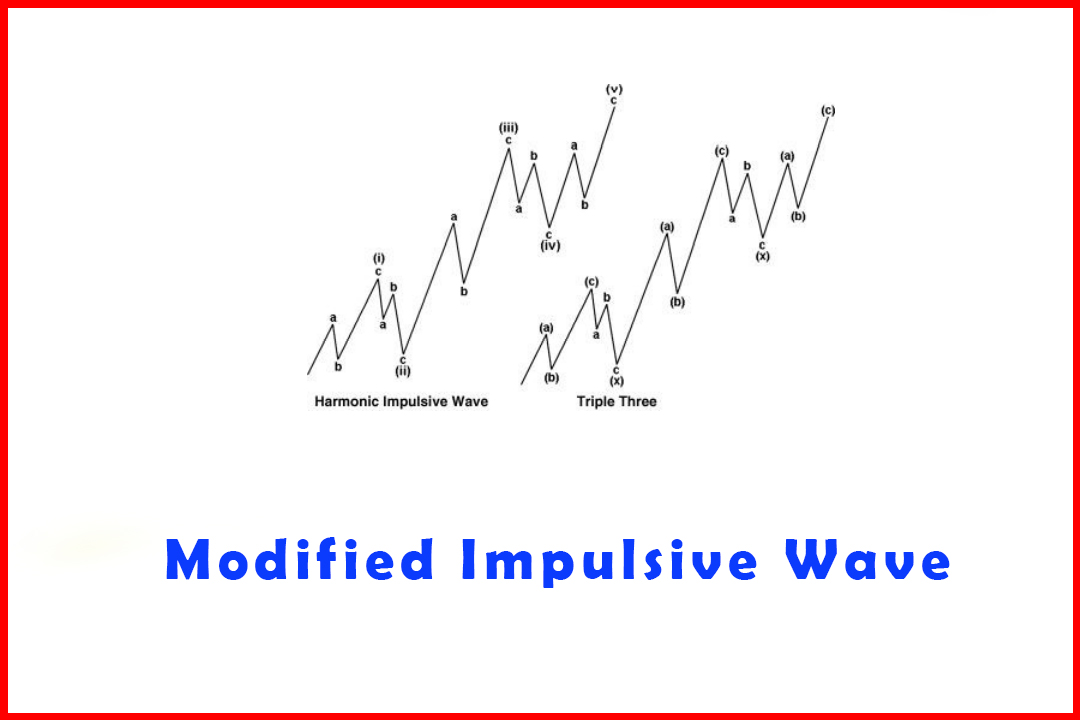
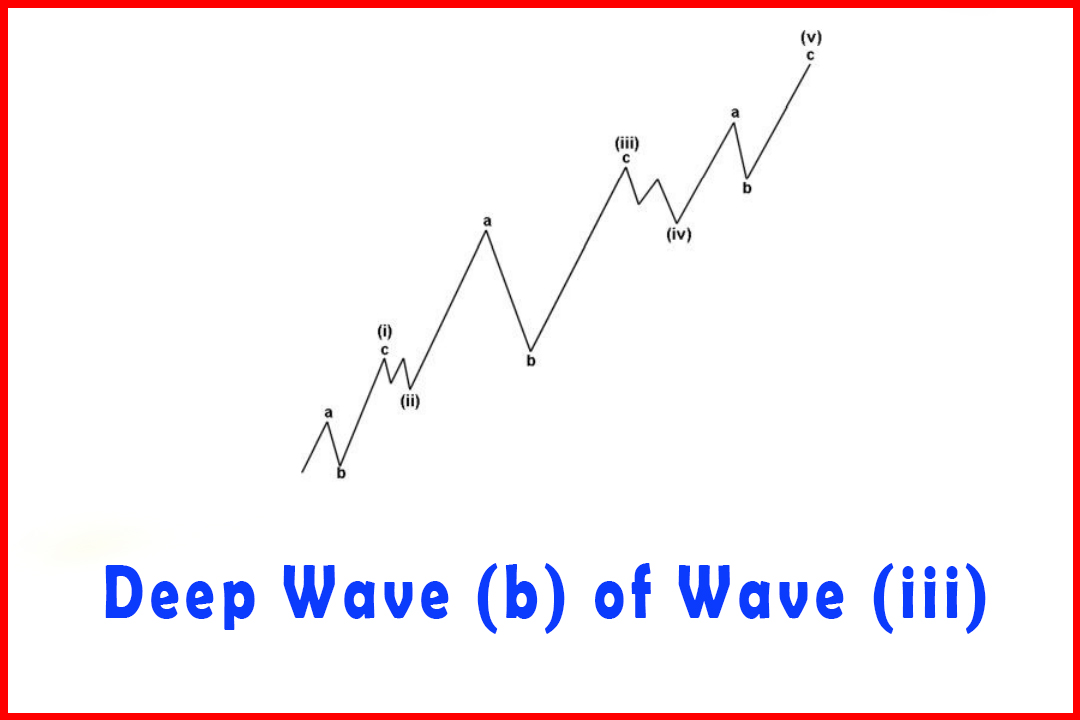
However,
as I have already described, a deep Wave (b) in Wave (iii) can cause the
structure to look totally unlike a five-wave move. The importance now of
understanding that such an event can occur forewarns that eyeballing a chart
simply does not work all the time.
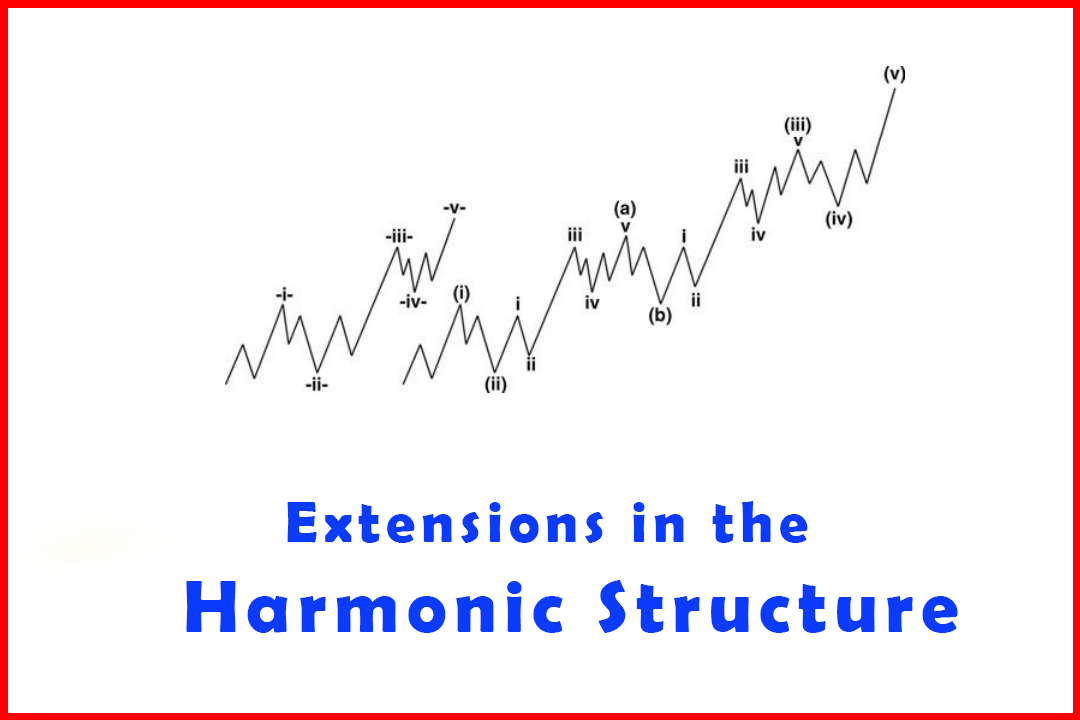
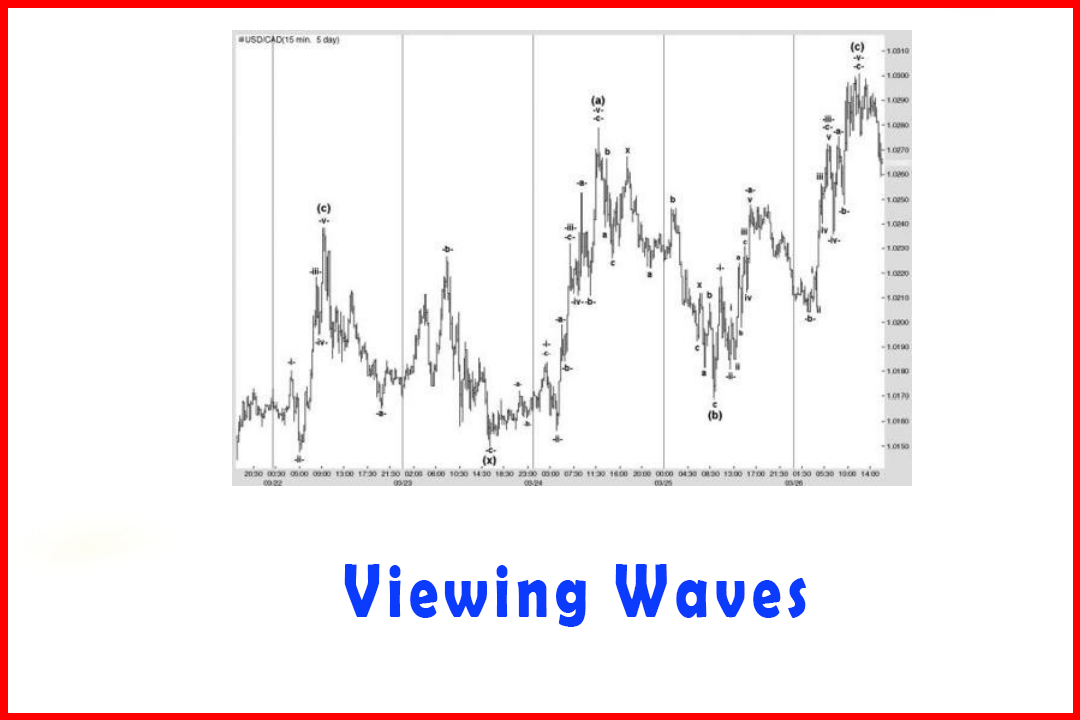
Take
the following situation in the 15-minute market of USDCAD, which was forming a
correction higher in Wave (iv). It had already completed one (a)(b)(c)
correction, then saw the pullback in Wave (x), to be followed by a second
(a)(b) (c) rally. However, note in Wave (b) that the Wave -b-of Wave -iii-had a
deep retracement of 66.7%.
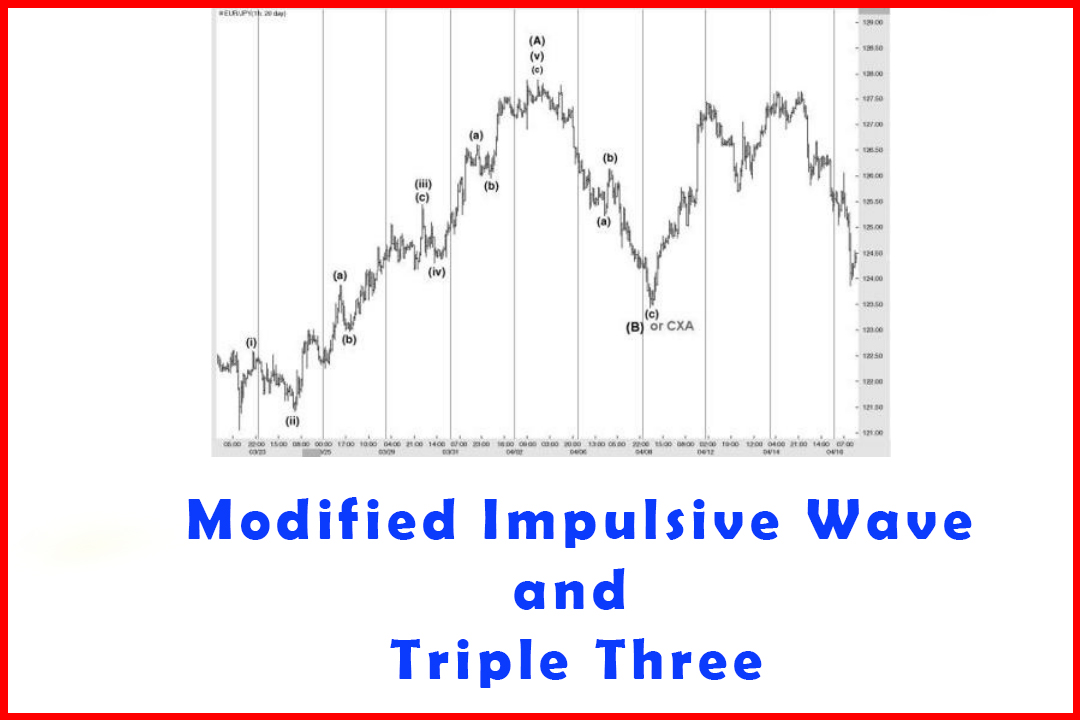
In
Figure 3.27, all wave relationships adhered to normal Fibonacci or harmonic
ratios that are explored more fully in Chapter 4. Not only did the (a)(b) (c)
waves conform to these ratios but the waves of lower degree also produced
targets relevant to the structure of larger degree, which cements the structure
rather than leaving it to just observing the major highs and lows.
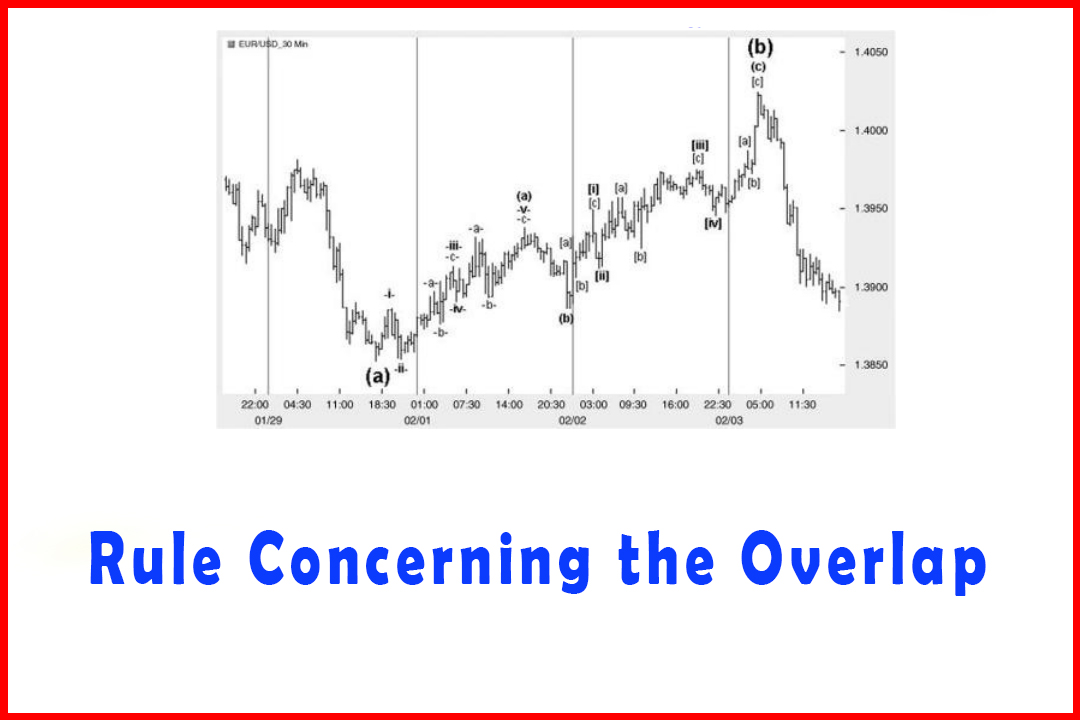
Figure 3.27 A Deep
Wave -b-in Wave -iii-Higher in Wave (c) in 15-minute USDCAD
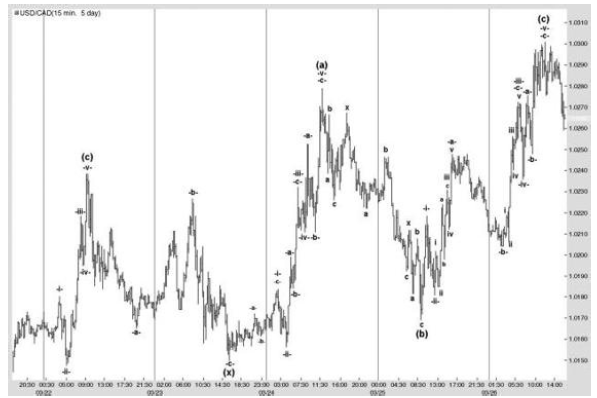
If
an analyst or trader merely eyeballed the rally in Wave (c) the assumption will
be that it possibly developed in two sets of three waves, or possibly that the
Wave (c) peak was actually Wave 3 of an extension in Wave (3).
Harmonic Elliott Wave : Chapter 3. Impulsive Wave Modification : Tag: Elliott Wave, Forex : How to View Waves, How to draw waves, Fibonacci Trading Strategy, Harmonic ratios - Viewing Waves Without Making Measurements
Elliott Wave | Forex |