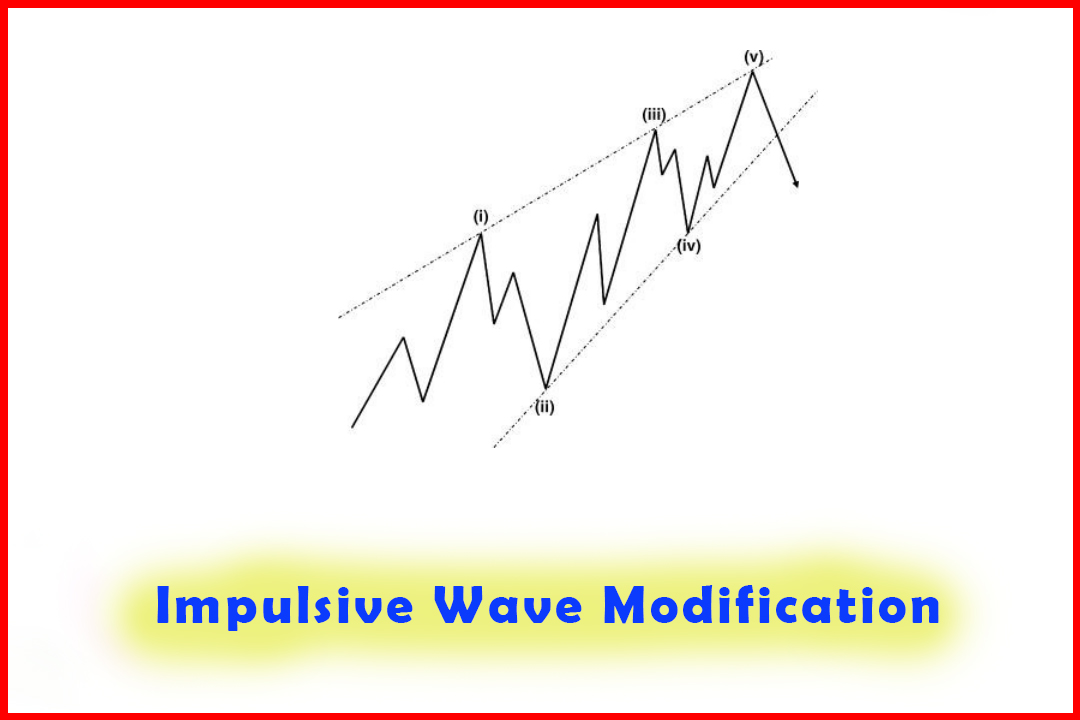
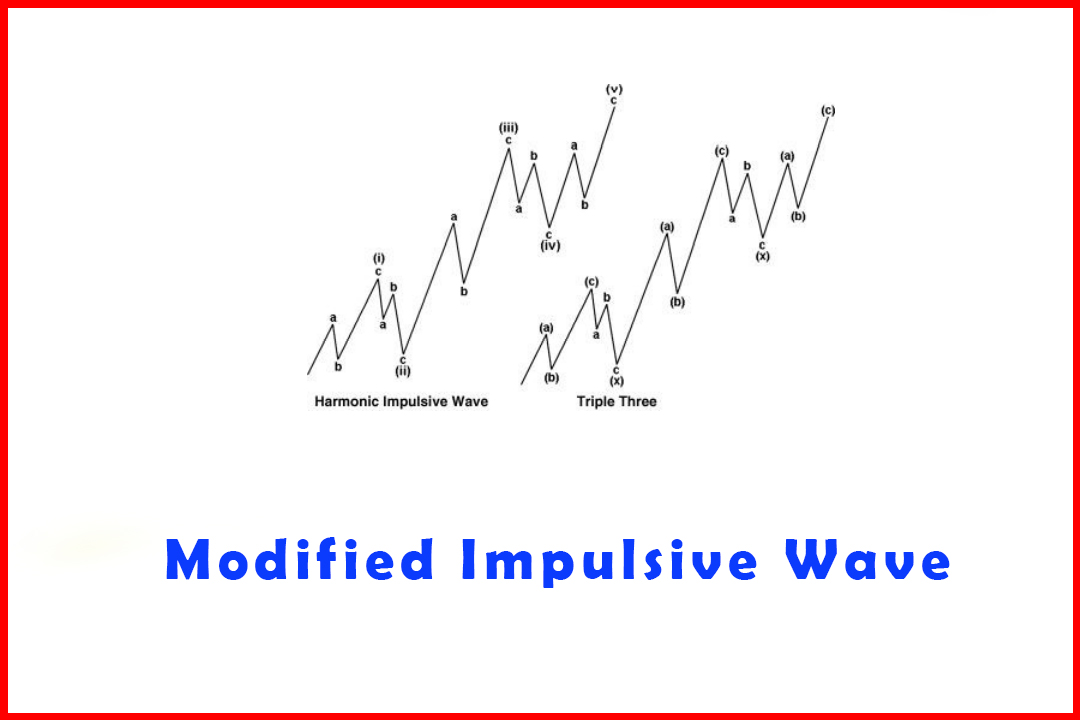
Difference Between a Modified Impulsive Wave and a Triple Three
Modified Impulsive Wave, Triple Three Trading Strategy
Course: [ Harmonic Elliott Wave : Chapter 3. Impulsive Wave Modification ]
Elliott Wave | Forex |
On the occasions I have mentioned my findings to others, a frequent question is how to spot the difference between a modified impulsive wave and Triple Three.
Identifying the Difference Between a Modified Impulsive Wave and a Triple Three
On
the occasions I have mentioned my findings to others, a frequent question is
how to spot the difference between a modified impulsive wave and Triple Three.
While there will always be occasions when it is harder to follow a structure,
in the majority of instances they are quite simple to identify. There are
several key issues to note. While there is no single 100% solution for this,
there are guidelines that identify the difference in the majority of cases:
Triple
Threes must develop as a corrective wave: Wave (b), Wave (ii), Wave (iv), or
Wave (x). Therefore reference to the structure of the next higher wave degree
is of utmost importance.
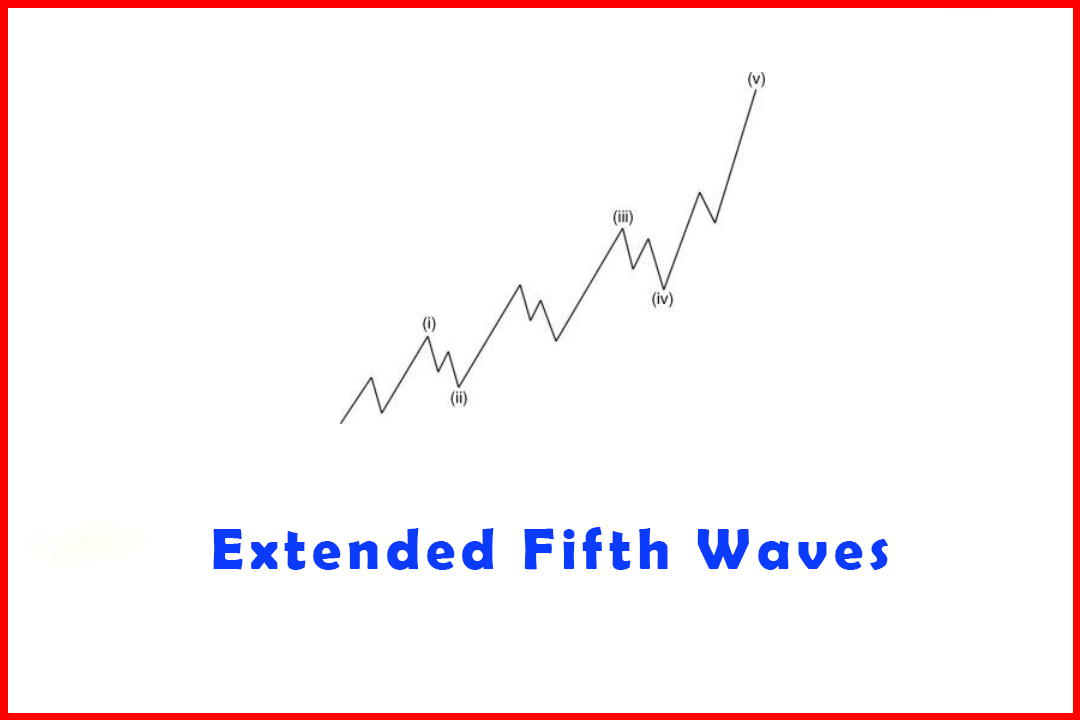
While
Waves (ii), (iii), (iv), and (v) have relationships with each other, the three
groups of ABC waves in a Triple Three rarely have relationships between them.
While
even impulsive waves can get quite complex, it is far more common for Triple
Threes to display a high level of complex structures.
I
shall provide one example of how this should be watched.
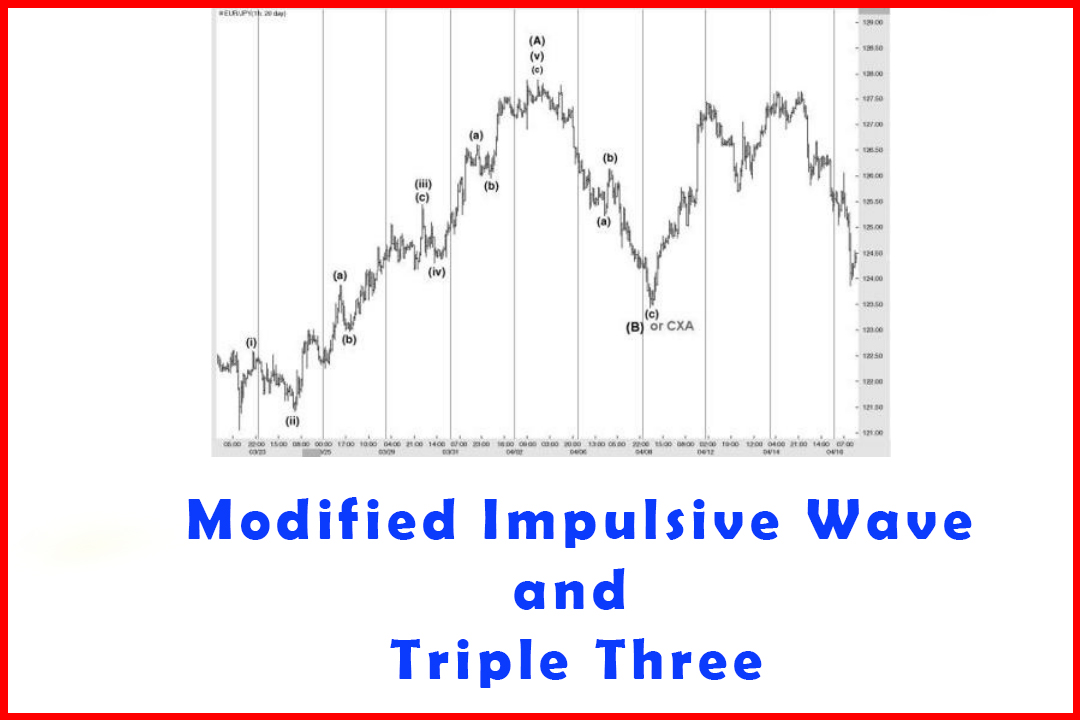
Figure
3.15 displays the hourly market in EURJPY in which there appears to be a
five-wave rally from 121.05 to 127.89. This is followed by a decline in three
waves. At this point with the correction being in three waves we cannot be
certain whether this is a complete Wave (B) or Wave cxa of a complex
correction.
Figure 3.15 A
Five-Wave Rally Labeled Wave (A) Followed by a Three-Wave Decline
Therefore,
as the rally from the 123.42 low develops it will be important to watch for
evidence of either the development of an impulsive structure or a corrective
structure that could develop as a Triangle, Flat Correction, or Expanded Flat
Correction.
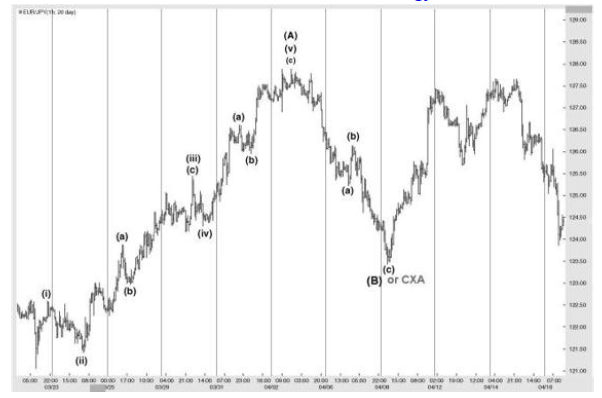
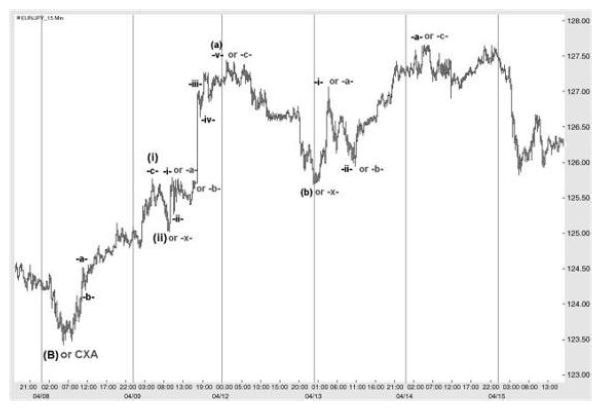
Figure
3.16 displays the rally seen from the Wave (B) (or Wave CXA) low. While it
would be simple to say that all wave structures are obvious from the wave
relationships, it is not uncommon for there to be a degree of uncertainty where
there are perhaps two projections of Wave -a-that match with subsequent peaks.
Figure 3.16
Breaking Down the Rally from Wave (B) to Identify the Structure
However,
in the case that this rally will become a larger Wave (C) and will therefore
end above 127.89, the Wave (i) must be of a suitable degree that would imply a
strong wave (iii) projection should end close to or preferably above 127.89. In
this example there was a very close relationship between the first Wave -a-and
the Wave -c-so that we could consider labeling this peak as a potential Wave
(i).
The
correction was very shallow, stalling just above the prior swing low that would
be Wave iv of Wave -c-. The move to new highs would imply that Wave (a) of Wave
(iii) or a second ABC move is developing. This rally was quite ambiguous, with
the impulsive structure having a truncated Wave -v-, while for the -a-, -b-,
-c-move to hold more accurate projections the Wave -b-must be considered to
have developed in an ascending Triangle.
Therefore,
at this stage the apparent cleaner look would favor a rally in Wave (a) of Wave
(iii). However, the truncated Wave -v-and the better relationship between the
alternative Wave -c-to Wave -a-provided an uncertainty to the entire structure.
This implies that close scrutiny of the following rally to identify whether
this will be a five-wave move in Wave (c) or a three-wave move in a third -a-,
-b-, -c-to complete a Triple Three must be undertaken. This latter alternative
will imply that the pattern will probably be a Flat Correction with a final
stalling point close to the 127.89 high or an Expanded Flat Correction that
adheres to common expansion ratios.
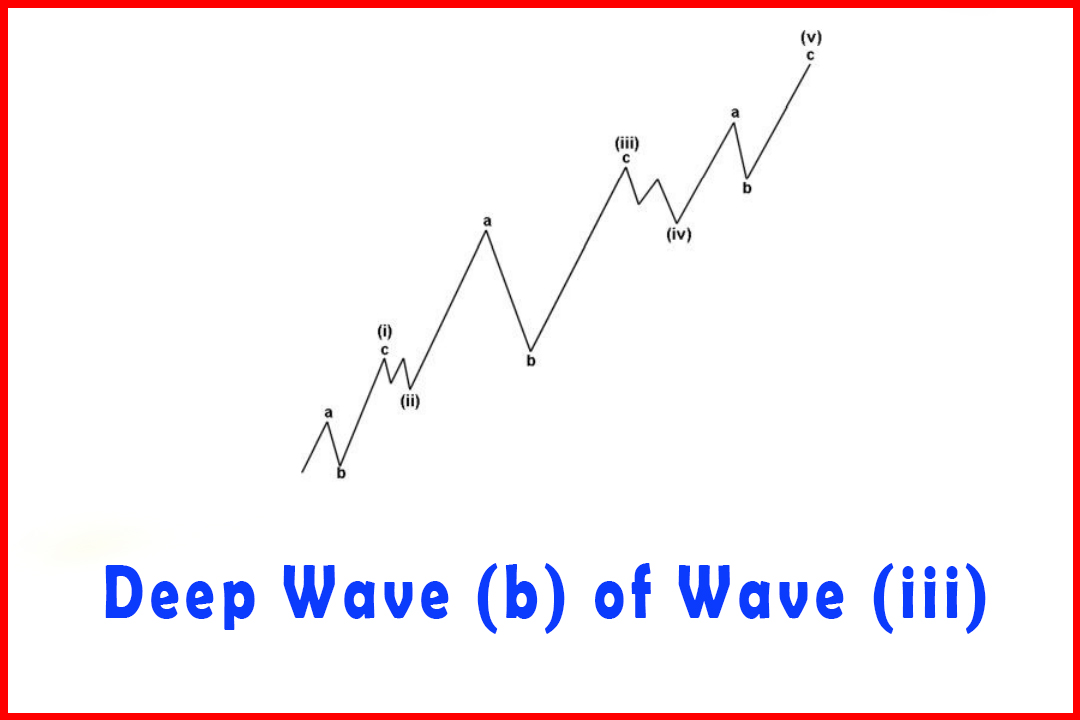
The
depth of the decline from the (potential) Wave (a) high was exceptionally deep.
This could still hold within an impulsive rally as Wave (ii) was exceptionally
shallow, so there was potential for this to be a deep Wave (b).
From
this point there must be a clear distinction to establish whether a Wave (c)
will develop to complete Wave (iii) or whether there will be a third -a-, -b-,
- c-move. Price recovered sharply and then saw a deep pullback. (The rally is
labeled Wave -i-or Wave -a-and the correction as Wave -ii-or Wave -b-.) Attempt
should be made to establish whether the rally developed in five waves or three.
Looking at the rally from the Wave (b) or Wave -x-low there is a sharp initial
move followed by a brief correction and then a stronger follow-through to a
peak that is labeled Wave -i-or Wave -a-. It certainly looks like three waves
in this time frame (15 minutes) but what appears to be Wave (c) is so sharp it
could hide the true nature of the structure.
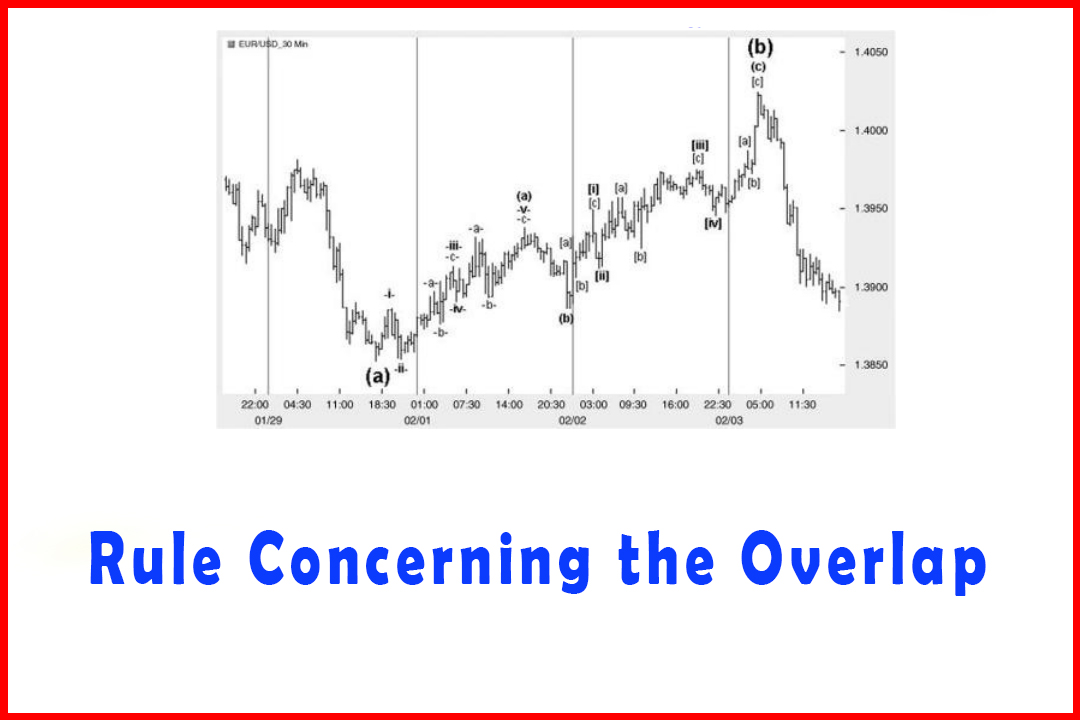
If
it remains unclear then the labeling should continue to be “Wave -i-” or “Wave -a-” and
the subsequent rally should be observed. The confusion will be that a five-wave
rally will be expected in both alternatives, either as Wave -a-of Wave -iii-or
in a Wave -c-. The end of this rally moved to a marginal new high but below the
high in Wave (A) in Figure 3.15 at 127.89.
From
this point there are two alternatives. Either the decline will be a correction
in Wave -b-of Wave -iii-or the implication of a retracement of more than 50% of
the Wave -a-will suggest the rally is complete and it can be safely assumed
that this had been a Triple Three, and therefore a return to the Wave (B) low
will occur in a possible Flat correction.
This
example reflects an uncertain outcome as the structural development from the
Wave (B) low was unclear. However, in the majority of cases it is normally
possible to note one of several factors that will reveal the true nature of the
move:
Not
only was the assumed Wave (ii) shallow but also Wave (b) of Wave (iii) and Wave
(iv). Occurrences of limited pullbacks point to the structure more likely being
a Triple Three.
The
relationships between the three ABC moves (that is, the anticipated Waves (i),
(iii), and (v)) were not harmonic, which again suggests this is more likely to
be a Triple Three.
The
projection in the anticipated Wave (iii) would not be deep enough to satisfy a
Wave (v) that would match with a projection in the Wave (C) of the higher
degree.
Harmonic Elliott Wave : Chapter 3. Impulsive Wave Modification : Tag: Elliott Wave, Forex : Modified Impulsive Wave, Triple Three Trading Strategy - Difference Between a Modified Impulsive Wave and a Triple Three
Elliott Wave | Forex |