Bullish and Bearish Divergence in Forex Trading Strategies
What is divergence in forex trading, What is divergence trading strategy, What is divergence day trading, What is divergence in stock
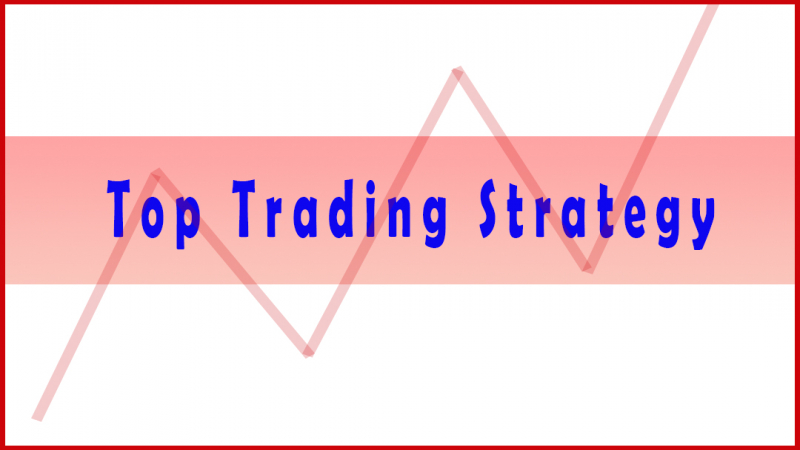
Course: [ Top Trading Strategy ]
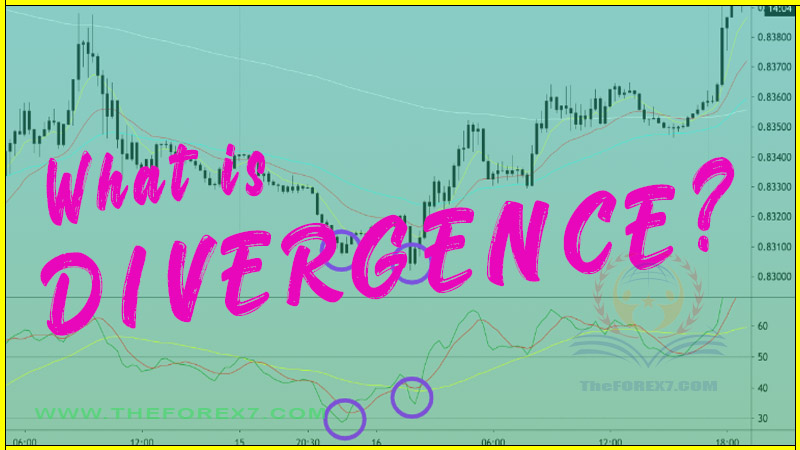
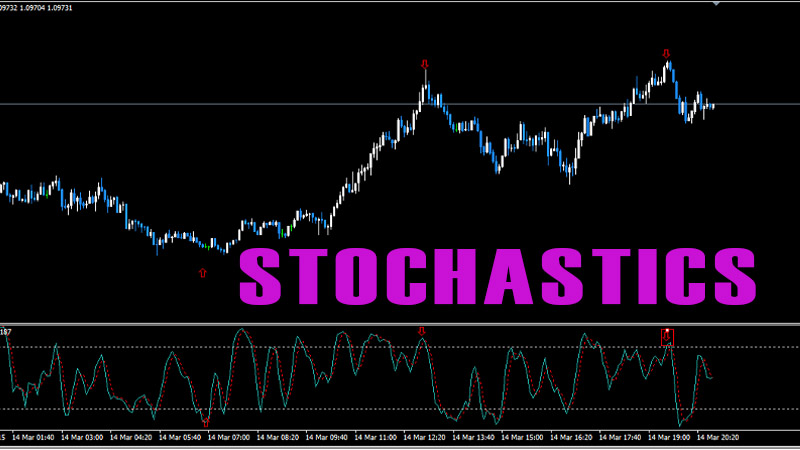
A disagreement between price action and the indicator (RSI). Divergence is telling us that the market is changing.
WHAT
IS DIVERGENCE?
· A disagreement between price action
and the indicator (RSI)
· Price will lie, the indicator will
not.
· You can use this to spot the end of a
pullback or at the point of a possible reversal.
· Divergence is telling us that the
market is changing.
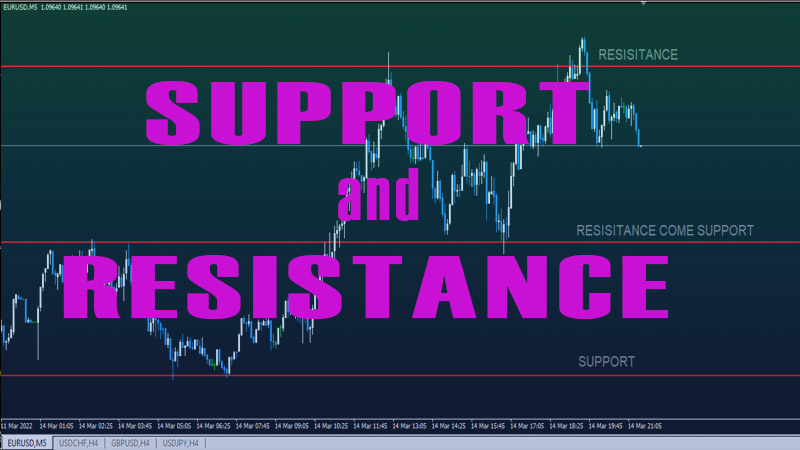
WHAT ARE THE MOST IMPORTANT LEVELS?
· Asian session high/low
· Yesterday’s high/low
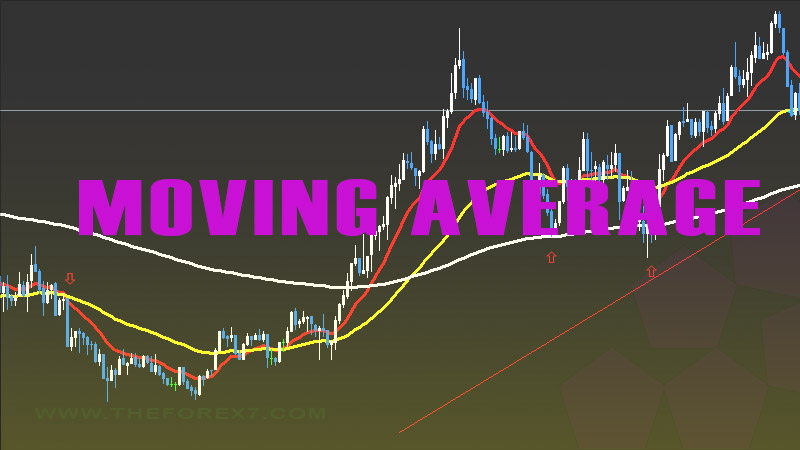
· 50, 200, 800EMAs (pullbacks move off
these levels)
· ADR Max (reversal point)
WHAT DOES IT TELL US?
· If in a trade, and divergence
presents against us we may need to consider an exit.
· If we are looking to enter a trade
into divergence we have to note that it will be a less probable trade because
divergence is present.
· Don’t assume reversal just because
divergence is present, use it as a warning flag.
· You can find it in trend and counter-trend
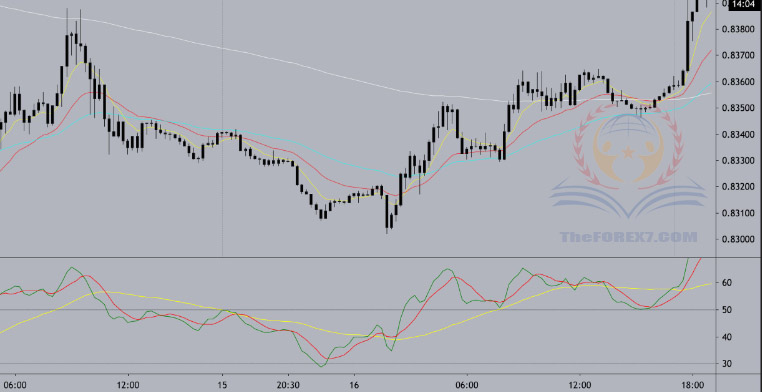
HOW DO WE USE DIVERGENCE?
Two ways
In Trend (D1)
We find divergence at significant levels that tell
us when the pullback is complete and the trend is ready to continue
Counter Trend (D2)
We see the divergence at the extremes, telling us
that a potential change is about to occur - either a chop or a reversal of some
degree
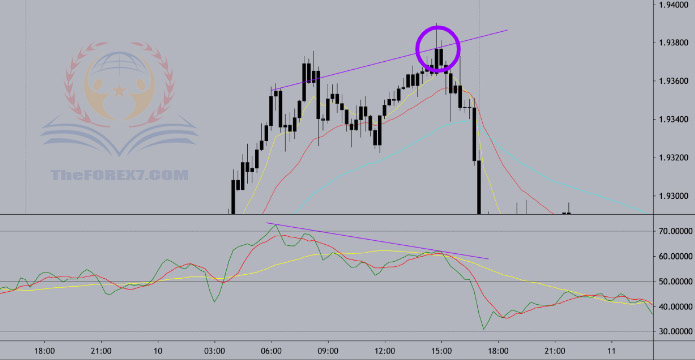
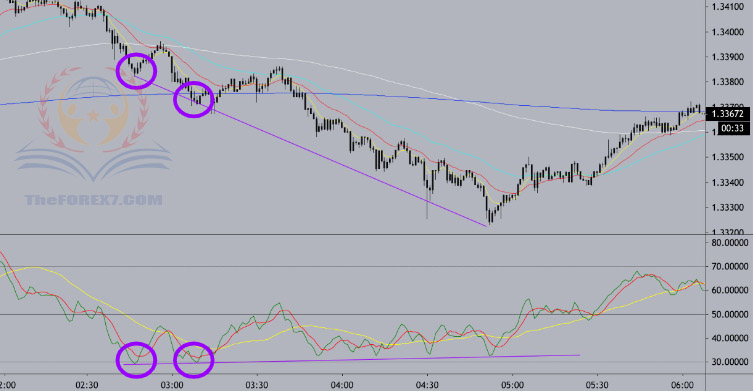
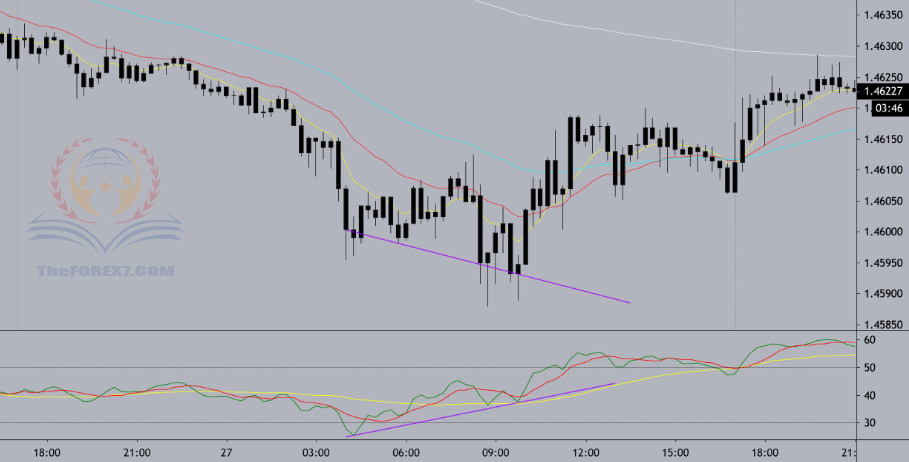
BULLISH DIVERGENCE
BEARISH DIVERGENCE
WHERE DO WE DRAW IT IN AN UPTREND?
(L50 in the buy zone & EMAs long
biased)
·
Bullish
divergence would present off an EMA or significant level, in direction of the
trend
·
Drawn on the
bottom of price action and the RSI
·
D1 Entry in
direction of the overall trend
·
Bearish
divergence would present at a significant level (OB/OS or Maxed ADR) going
counter-trend
·
Drawn on top
of price action and the RSI
·
D2 entry
signaling reversal off the top
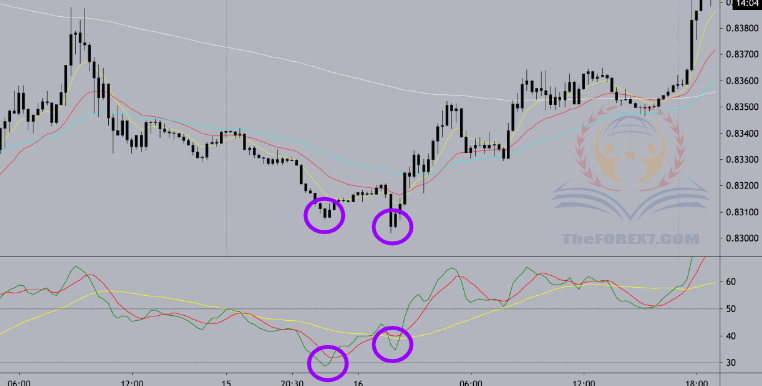
WHERE DO WE DRAW IT IN A DOWNTREND?
(L50 in the sell zone & EMAs
short biased)
·
Bearish
divergence would present off an EMA or significant level in direction of the
trend
·
Drawn on the
top of the RSI and price action
·
D1 entry -
used to get into a trade-in direction of the overall trend
·
Bullish
divergence would present at an extreme and off a key level
·
Drawn on the
bottom of price action and the RSI
·
D2 entry -
used to find a bottom signaling reversal
HOW DO YOU DRAW DIVERGENCE?
·
Find the RSI
high or low (reaction point 1)
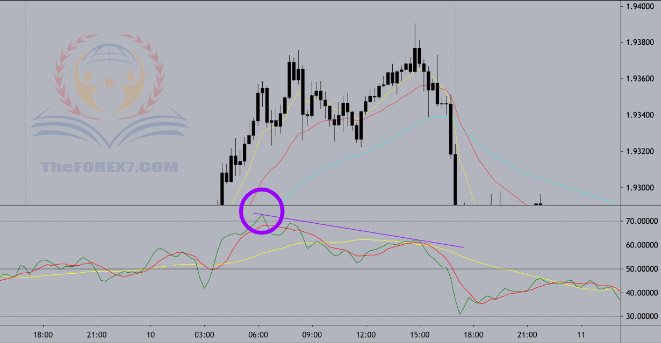
· Find the price action high or low (reaction
point 2)
2 REACTION POINTS
IDENTIFYING THE TWO
POINTS
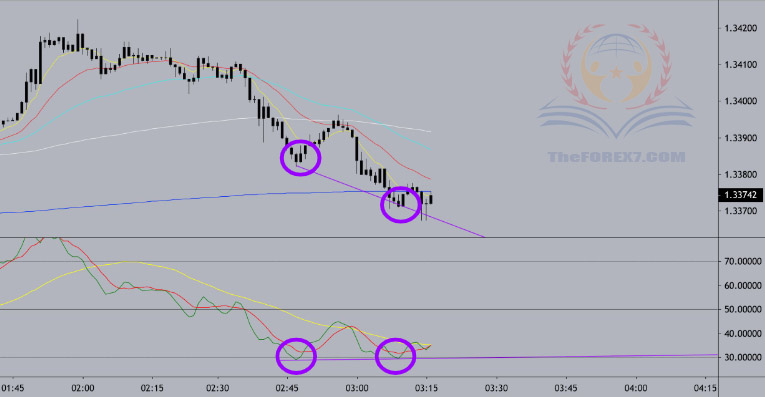
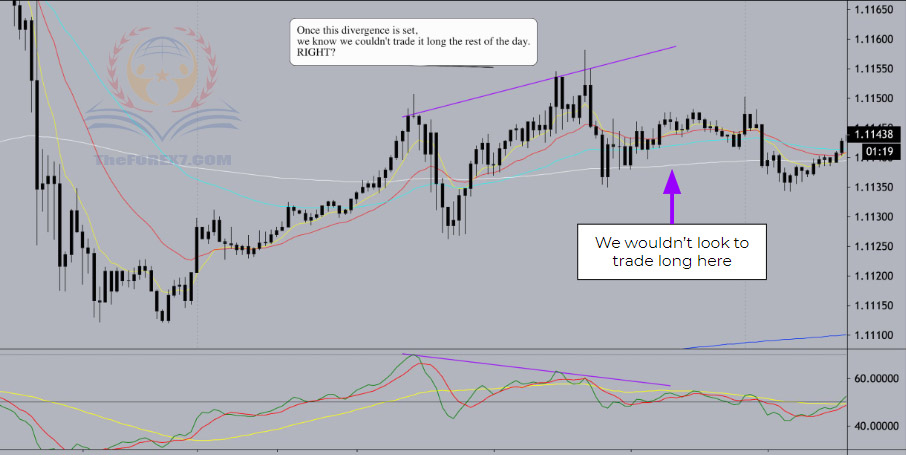
IT CAN HOLD DIVERGENCE
FOR HOURS
PRACTICE IDENTIFYING
DIVERGENCE
HOW DO YOU TURN THIS INTO AN ENTRY SIGNAL?
NAMING THE SIGNALS
In trend: D1
Countertrend: D2
WHAT’S THE DIFFERENCE?
In trend:
The signal will be of a significant level like the 50ema, 200ema, or
Asia high, yesterday's high, etc...
The higher time frames agree with the direction, multiple reasons to be
in this trade
WHAT’S THE DIFFERENCE?
Countertrend:
These will present at the extremes — OB and OS — looking for a full
reset back to the 800ema
These should also use the higher time frames to confirm or deny the
direction you're trading in the reversal
Top Trading Strategy : Tag: Top Trading Strategy, Forex : What is divergence in forex trading, What is divergence trading strategy, What is divergence day trading, What is divergence in stock - Bullish and Bearish Divergence in Forex Trading Strategies