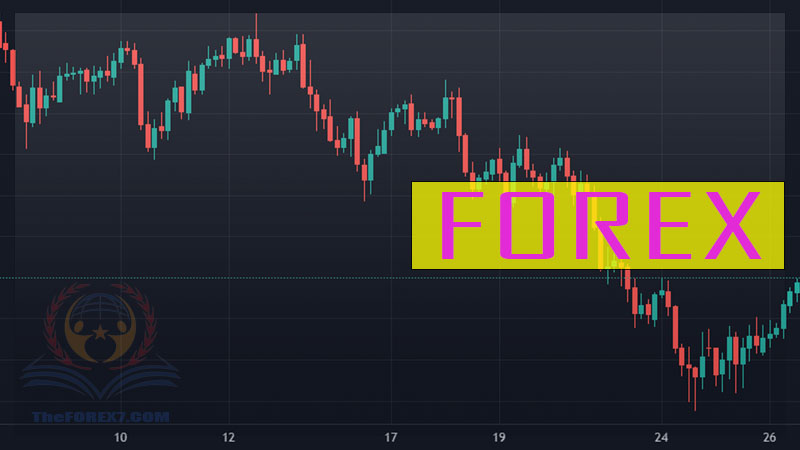
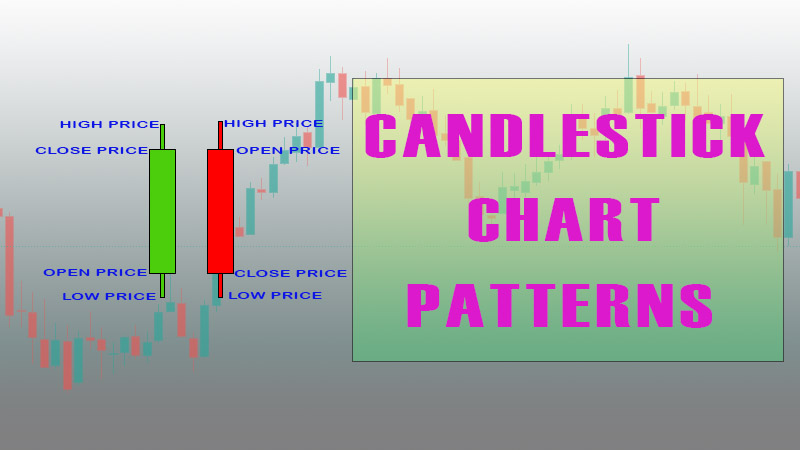
CANDLESTICK CHART PATTERNS IN FOREX TRADING
BULLISH PATTERN | BEARISH PATTERN | HEAD & SHOULDER PATTERN | DOUBLE TOP
Course: [ Top Trading Strategy ]
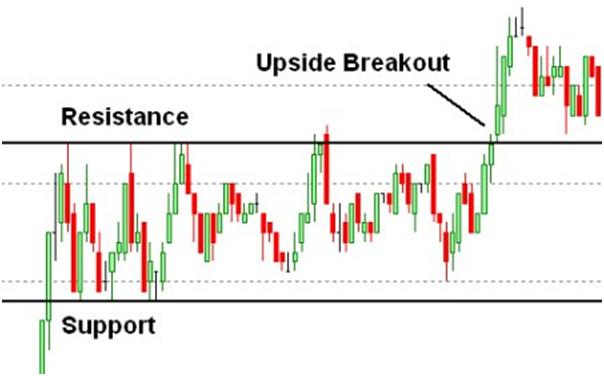
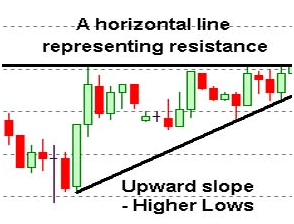
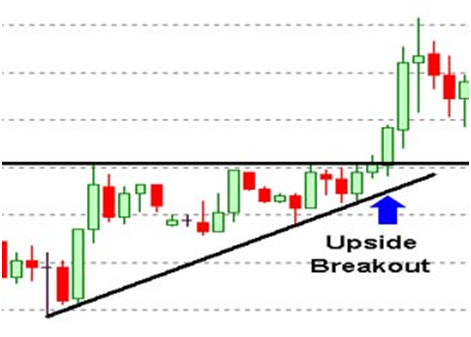
A rectangle is basically a trading range bound by two horizontal lines marking the top and bottom of the range (See Figure 1). It can either be a continuation or reversal pattern, although it should be assumed that the breakout will occur in the direction of the existing trend unless proved otherwise by technicals or market sentiment.The upper line acts as resistance, where the lower line acts as support. This pattern is very commonly found in Forex charts, and indicates a temporary balance between buyers and sellers in the transition period.
Chart Patterns
In this lesson, I will teach you some
basic chart patterns which may signal trend continuation or reversal. If you
spot them before the patterns are completed, you may be in for a high
probability trade. If you recall, the aim of technical analysis is to spot big
movements before they happen so that you can take advantage, and prepare for a
trade at a good entry point.
Here are some of the patterns that I am going to cover:
Rectangle
 Figure
1
Figure
1
A rectangle is basically a trading range bound
by two horizontal lines marking the top and bottom of the range (See Figure 1).
It can either be a continuation or reversal
pattern, although it should be assumed that the breakout will occur in the
direction of the existing trend unless proved otherwise by technical or market
sentiment. The upper line acts as resistance, while the lower line acts as
support.
This pattern is very commonly found in Forex charts and indicates a temporary balance between buyers and sellers in the transition period.
Symmetrical Triangle
 Figure
2A
Figure
2A
 Figure
2B
Figure
2B
Symmetrical triangles are known to be very
unreliable formations.
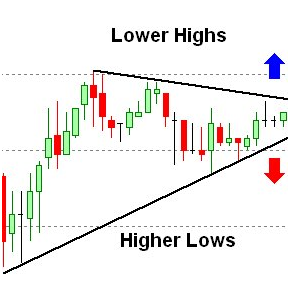
As you see from Figure 2A, a symmetrical
triangle is consists of two converging trendlines that join a series of lower
highs and higher lows. Although we should assume that the pattern will be
resolved in the existing trend direction, breakouts can be either to the upside
or downside, and there is no way you can predict its direction until one of the
lines are penetrated.
Breakouts usually occur in the final 1/3 of the
triangle, as can be seen in Figure 2B.
Ascending Triangle
 Figure
3A
Figure
3A
 Figure
3B
Figure
3B
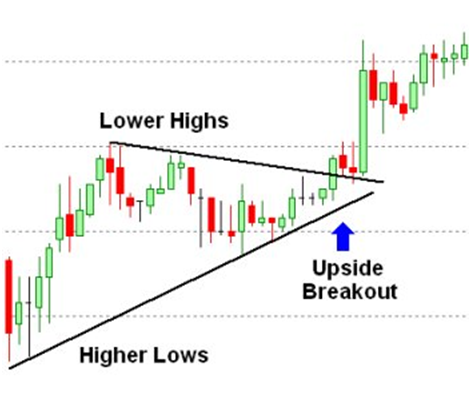
Ascending or descending triangles can be
reversal or continuation patterns. They are more reliable and more predictive of
future price movements than symmetrical triangles. Unlike symmetrical
triangles, one of the lines is horizontal. Ascending triangles are bullish
patterns based on their upward slope.
In Figure 3A, the pattern shows an upward
sloping trendline that creates the lower boundary of the triangle with higher
lows. The upper boundary, which is approximately horizontal, represents
resistance. Every time the currency price goes up to a certain level, people
are more enthusiastic about selling at the high. But once the price exceeds
this psychological level, the sellers are caught in the wrong direction and
are desperate to close their shorts by bidding higher. It is common for the
breakout to occur in the final 1/3 of the triangle formation.
Figure 3B shows the upside breakout of this
pattern.
If the ascending triangle is formed during an
existing uptrend, it acts as an uptrend continuation pattern. But if it is
formed during an existing downtrend, it acts as a bullish reversal pattern.
Descending Triangle
 Figure
4A
Figure
4A
 Figure
4B
Figure
4B
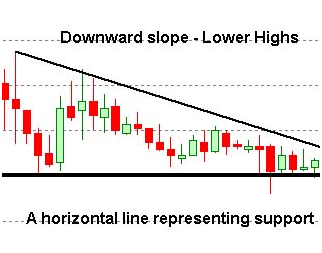
Descending triangles are bearish patterns based
on their downward slope.
In Figure 4A, the downward sloping trendline
creates the upper boundary of the triangle with lower highs. The lower
boundary, which is approximately horizontal, represents support. Every time the
currency price goes down to a certain level, people are more enthusiastic about
buying at the low. But once the price goes below this psychological level, the
buyers, positioned in the wrong direction, become desperate to cover their
longs. It is common for the breakout to occur in the final 1/3 of the triangle
formation.
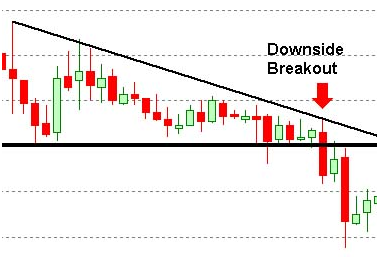
Figure 4B shows the downside breakout of this
pattern.
If the descending triangle is formed during an
existing downtrend, it acts as a downtrend continuation pattern. But if it is
formed during an existing uptrend, it acts as a bearish reversal pattern.
Trading Tips for Ascending or Descending Triangles
- Remember
that they may be continuation or reversal patterns based on whether the
slope is downward or upward.
- They
are commonly found in Forex charts.
- As
continuation patterns, they are an ideal second entry point to join the
existing trend if you have missed the first signal.
- If
you are already involved in existing trend, it may be a good point to add
to your positions.
- But if you spot it as a reversal signal, you may wish to place your stop below the support horizontal line or above the resistance horizontal line if the trend turns against you.
Double Top
 Figure
5
Figure
5
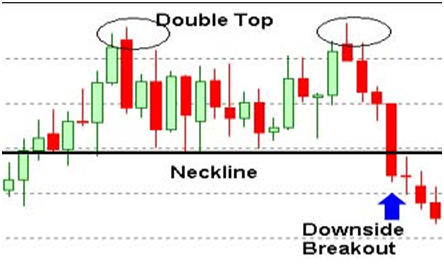
Double tops are quite commonly found on the
charts and offer very good reversal signals. It is a good place to enter early
on a trend reversal.
Figure 5 shows a double top pattern consisting
of two final peaks separated by a valley. The two peaks need not be of the same
height for the pattern to be considered a double top. When the price breaks
below the neckline connecting the valley low and the base of the tops, it
signals a downside breakout and a good entry point for shorting.
The objective of the breakout is measured by projecting the maximum distance between the higher top and the neckline from the breakout point.
Double Bottom
 Figure
6
Figure
6
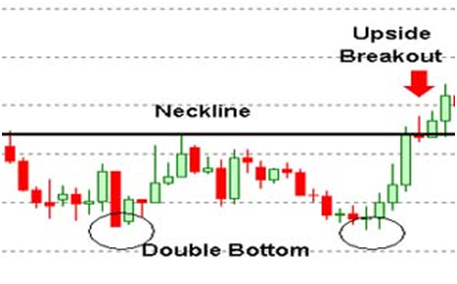
A double bottom is a mirror image of a double top. Figure 6 shows an upside breakout from the neckline violation.
Trading Tips for Double Top and Bottom
- Sometimes
double tops and bottoms may extend into triple or even quadruple tops or bottoms,
which are far less common.
- Triple
or quadruple tops or bottoms represent a more prolonged battle between
buyers and sellers, and hence such breakouts are usually followed by more
forceful reversals.
- From experience, I find that double tops and bottoms generally give more reliable reversal signals than heads and shoulders, which are covered next.
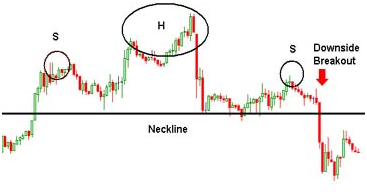
Head and Shoulders (H&S)
Head-and-shoulders can occur as reversal or
continuation formations. If the pattern is found at the end of an uptrend, it could
signal a bearish reversal or consolidation period before continuing the
uptrend. If it is found at the end of a downtrend, it could signal a bullish
reversal or consolidation period before resuming the downtrend. H&S
reversal patterns are notorious for false breakouts.
Figure 7 shows a classic head and shoulders pattern at the end of an uptrend.
It consists of the head, which is the final rally, separated by two smaller
rallies, known as shoulders, that need not be identical. The neckline shown
here is a horizontal trendline drawn connecting the lows of the left and right
shoulder. When the price breaks decisively below the neckline, the trend is
deemed to have reversed.
 Figure
7
Figure
7
The minimum price objective is obtained by
measuring the distance from the head to the neckline, and projecting it down
from the breakout point.
When the H&S fails, it will usually rebound and may stage an explosive rally off the neckline because sellers of the H&S downside breakout will have their stops triggered when the direction goes against their positions.
Inverse Head and Shoulders
The inverse head and shoulders is similar to the
H&S above, except that it is upside down.
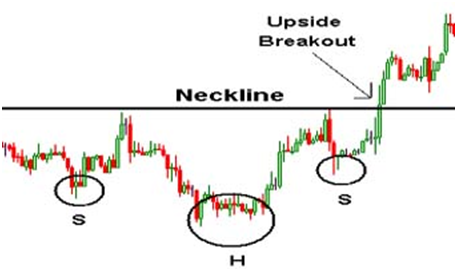 Figure
8
Figure
8
As you can see from Figure 8, it consists of the
head, which is the final low, separated by two smaller declines which make up
the left and right shoulders. The neckline shown here is a horizontal trendline
drawn connecting the highs of the left and right shoulder. When the price
breaks decisively above the neckline, the trend is deemed to have reversed.
The minimum price objective is also obtained by
measuring the distance from the head to the neckline, and projecting it down
from the breakout point.
Similarly, when the inverse H&S fails, it may stage an explosive decline off the neckline because the majority of the market is poised in the wrong direction, and many stops will be triggered as shorts are forced to cover.
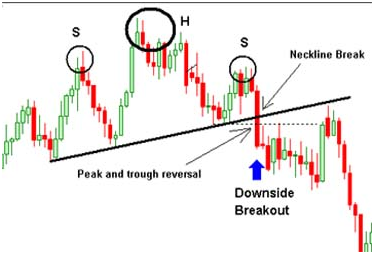
Sloping Head and Shoulders
A sloping H&S refers to either an upward or
downward sloping of the neckline.
From Figure 9, you can see that, unlike the
horizontal H&S, the upward-sloping break occurs in two stages: first with a
neckline break, then followed by a peak and trough violation. It is better to
short from the peak and trough break as the evidence is reinforced by this
second violation.
 Figure
9
Figure
9
Note that the extended neckline later becomes
resistant, and triggers more selling pressure. The same rules apply to the
downward-sloping H&S.
Trading Tips for H&S
- A
H&S reversal is likely to fail if the trendline has a steep ascent or
decline.
- H&S failures can happen quite often in currency pairs, and unfortunately, there is no way of knowing if the failed pattern will be followed by a small or large price movement. Sometimes the price may explode, and at other times, the price may be in a confusing period of volatility. If you sense you are in the wrong direction, it is better to get out as quickly as you can.
Top Trading Strategy : Tag: Top Trading Strategy, Forex : BULLISH PATTERN | BEARISH PATTERN | HEAD & SHOULDER PATTERN | DOUBLE TOP - CANDLESTICK CHART PATTERNS IN FOREX TRADING