Different Types of Moving Average: Chart Example and Tips
Moving average method, Moving average in statistics, Moving average for intraday, Moving average method example, Trend Identification
Course: [ Top Trading Strategy ]
A moving average (MA) is a trend-following indicator, which means that it turns after the trend has reversed. It shows the average value of prices in its time-window, which you specify. A 20-day MA shows the average price for the past 20 days, a 100-day MA shows the average price for the past 100 days.
What is a Moving Average?
A moving average (MA) is a trend-following indicator,
which means that it turns after the trend has reversed. It shows the average
value of prices in its time window, which you specify. A 20-day MA shows the
average price for the past 20 days, a 100-day MA shows the average price for
the past 100 days.
Types of Moving Averages
There are three main types of MA, namely, the
simple moving average (SMA), the exponential moving average (EMA) and the
weighted moving average (WMA). SMA gives equal weighting to each piece of data.
That would be each day for a daily chart, each week for weekly charts, and so
forth. EMA, on the other hand, gives greater weight to the more recent data,
thus making the average more sensitive to price changes. A weighted moving
average allows you to assign any weight to any day, depending on what you deem
important.
A lot of traders prefer to use EMA since it
responds to changes faster than an SMA, and does not drop old data as abruptly
as an SMA does. I prefer to use both SMA and EMA on my charts since some
studies have shown that using an EMA is not more advantageous than an SMA when
it comes to actual trading.
The choice of time span is important when using the
moving average technique. For example, it doesn't make sense to use a 100-day
moving average to monitor a short-term trade since the average will be so
smoothed out that you won't get any signal. On the other hand, if you use a
5-day moving average to monitor a long-term trade, you will end up with too
much noise with the countless whipsaws.
How to Use Moving Averages in Forex Charts
Trend Identification
Note the direction of the slope of a moving
average. If it is rising, it indicates an uptrend. If it is falling, it
indicates a downtrend. When the MA is flat, it means that the market is
sideways.
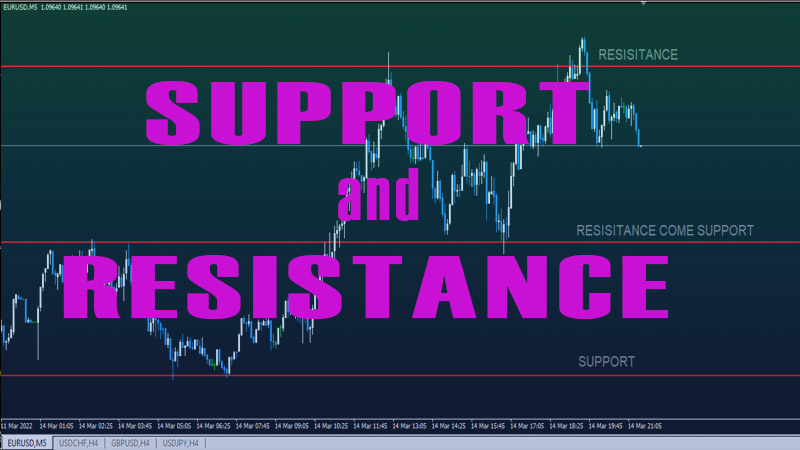
Dynamic Support and Resistance
Moving averages act as flexible support and
resistance areas. Depending on the market sentiment, it pays to buy near a
rising MA, and short-sell near a falling MA.
Crossover
When the market is bullish than before, prices
rise above / cross over a moving average. When the market is more bearish than
before, prices fall below / cross over a moving average. Use MA crossover
together with a price pattern completion or a trendline violation for better
results.
Real Chart Example
 Figure
1
Figure
1
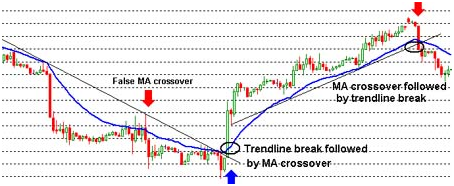
Figure 1 above shows an hourly
EUR/USD candlestick chart with a 22-day exponential moving average.
As you can see, a declining MA
indicates a downtrend whereas a rising MA indicates an uptrend. The first red
arrow shows that the currency price has broken above the EMA, but not above the
down trendline. If you had just bought above the EMA crossover, the trade would
have gone against you as the price quickly melted down from the trendline
resistance as reflected in the bearish candle with a long top arrow. If market
sentiment supported a weaker EUR against USD, the trendline resistance point
would have been a good place to short-sell.
A great opportunity to buy EUR/USD is
indicated by the blue arrow, when the EMA crossover (circled) had already been
preceded by the trendline break, confirming a bullish reversal signal. Next,
EUR/USD saw a period of an uptrend, as evidenced by both the up trendline and
the rising EMA, moving closely in tandem. It would have been a good place to
buy EUR/USD when the price approached the EMA and trendline support. The trend
reversal, as indicated by the second red arrow, happened when the price first
crossed below the EMA, then broke below the up trendline.
Trading Tips for Moving Averages
·
In
Forex trading, having multiple confirmations for trend reversal results in a
much higher probability of trade than just trading MA crossovers in general.
·
Keep
in mind that the steeper the ascent or descent of the MA, the more likely the
crossover will turn out to be a whipsaw.
In a trading range, a moving average
is almost flat, and so MA crossovers are almost always false. MAs work better
in trending conditions.
Top Trading Strategy : Tag: Top Trading Strategy, Forex : Moving average method, Moving average in statistics, Moving average for intraday, Moving average method example, Trend Identification - Different Types of Moving Average: Chart Example and Tips