JAPANESE CANDLESTICK CHARTS - HOW TO READ CANDLESTICK CHARTS?
candlestick charts, candlestick patterns, candlestick charting techniques, Reversal patterns, Continuation patterns
Course: [ Top Trading Strategy ]
Candlesticks are a way of displaying price information on charts. Although candlesticks have been used in Japan for several hundred years, they have only been recently adopted as an indispensable tool in the West.
Candlesticks In Forex Price Charts
Why Use Candlesticks?
Candlesticks are a way of displaying price information on the charts. Although candlesticks have been used in Japan for several hundred years, they have only been recently adopted as an indispensable tool in the West. The popularity of using candlesticks is due to their obvious visual representation of prices, compared to using bar or line charts. Compare Figure 1 with Figures 2 and 3 for the same currency price data for the same time period.
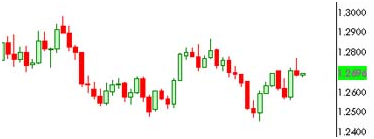
Figure 1 - A candlestick chart of EUR/USD
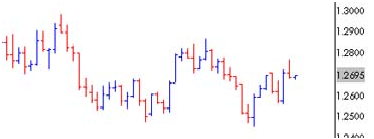
Figure 2 - A bar chart of the same EUR/USD chart

Figure 3 - A line chart of the same EUR/USD chart
Price Display in a Candle
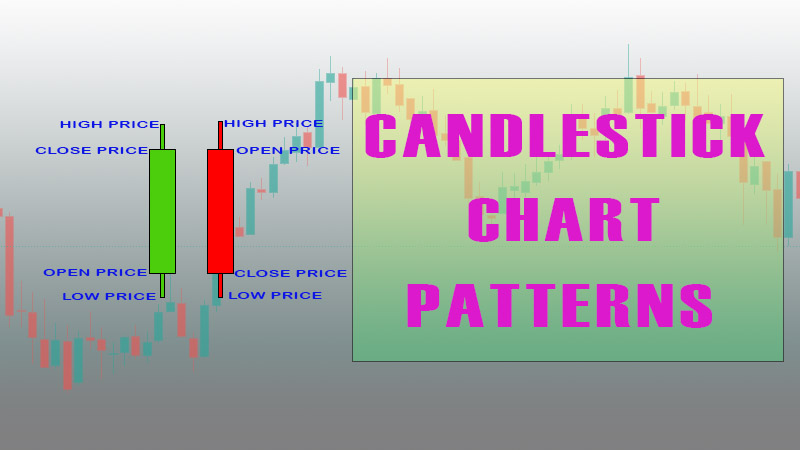
Each candle displays the opening, high, low and closing prices. The prices depend on the time-frame of usage. If you display candlesticks in a 1 min chart, each candle represents one minute, and if displayed in a daily chart, each candle represents a day. In Figure 4, the opening, high, low and closing prices are indicated on a down candle (left) and on an up candle (right). You can see that the lines, known as shadows, sticking out of the real body denote the high and the low of the period.
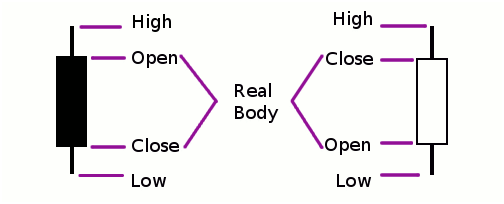 Figure 4
Opening and closing prices are extremely important to traders who use candlesticks, and they are represented in the chart by a rectangle (technically known as the real body). The size of the rectangle depends on the difference between the opening and closing price. If the opening price is lower than the closing price (i.e., closing higher), the candle is white or empty. If the opening price is higher than the closing price (i.e., closing lower), then the candle is black or filled in.
Why is it so easy to use a candle chart? Because if you see a white candle, you can tell immediately that it is an up day, and if you see a black candle, you know immediately it is a down day. You can, of course, customize the colors of the candles in your charting software. Throughout this course, I shall be using red candles to signify down periods, and green candles to signify up periods. For the examples in this lesson, I will use one candle to represent one day.
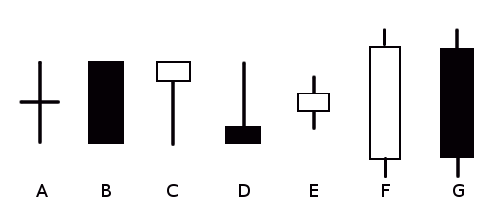 Figure 5
Figure 5 shows you how some common candlesticks look like.
A: Opening and closing prices are the same
B: Opening represents the high of the day, and closing represents the low of the day (hence no shadows required)
C: Opening and closing prices are near the high of the day
D: Opening and closing prices are near the low of the day
E: The day's trading small is small
F: The closing price is much higher than the opening price (tends to be bullish)
G: The closing price is much lower than the opening price (tends to be bearish)
How to Use Candlesticks in Trading?
- Reversal patterns
- Continuation patterns
There are tons of reversal and continuation candlestick patterns, but in this lesson, only examples of the most common ones are shown.
Some Key Reversal Patterns
Hammer

A 1-day bullish price reversal occurs after a decline. Remember it as 'hammering' out a bottom. A Hammer is formed when the price moves sharply lower from its opening price but returns close at the high of the day. The shadow should be at least twice as long as the size of the real body.
If this candlestick forms during an advance, then it is called a Hanging Man.
Hanging Man

A 1-day bearish price reversal occurs after a rally. A Hanging Man is formed when the price moves significantly lower after the open, but rallies to close well above the intraday low. The shadow should be at least twice as long as the size of the real body.
Harami

A 2-day bearish price reversal pattern that occurs after a rally. The second candle has a small red body that is completely contained within the range of the first green candle.
Harami Cross

A 2-day pattern is similar to the Harami. The difference is that the last day is a Doji.

A 2-day bearish price reversal occurs after a rally. The first candle has a long green body. The second opens at a new high, then closes below the midpoint of the body of the first candle.

A 2-day bullish price reversal occurs after a decline. The first candle has a long red body. The second opens at a new low, then closes above the midpoint of the body of the first candle.
Engulfing

A 2-day price reversal pattern can be bearish or bullish, depending on whether it occurs in an uptrend or downtrend. The figure here shows a bullish reversal after a decline, whereby the first day is characterized by a red body, followed by a day whose green body completely engulfs the previous day's body.
For a bearish reversal after a rally, the first day is characterized by a green body, followed by a day whose red body completely engulfs the previous day's body.
Inverted Hammer

A 1-day bullish price reversal pattern that occurs after a decline. The candle opens lower, trades higher, but closes near its open.
Shooting Star

A 1-day bearish price reversal pattern that occurs after a rally. The candle opens higher, trades much higher, then closes near its open. It looks like the Inverted Hammer except that it is bearish.
Gravestone Doji / Topping Tail

A 1-day bearish reversal pattern that occurs after a rally. It is formed when the open and the close occur at the low of the day. It resembles a gravestone and could signal impending doom.
Dragonfly Doji / Bottoming Tail

A 1-day bullish reversal pattern that occurs after a decline. It is formed when the open and the close occur at the high of the day.
Real Chart Examples of Reversal Patterns
Figure 6 shows an hourly chart of USD/CHF, with a Dark Cloud Cover pattern (circled) at the end of an uptrend, signaling bearish reversal. After pattern completion, place a short order a few pips below the low of the first green candle (short @ 1.2545), with a protective stop at mid-point of the red candle (@1.2578), and an objective at the low of the previous day (@ 1.2454). In this example, this trade would turn out a profit of 91 pips with an almost 1:3 risk /reward ratio.
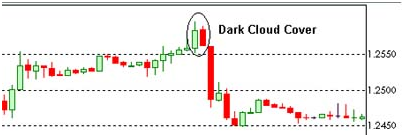 Figure 6
Figure 7 shows an hourly chart of EUR/USD, with a Topping Tail pattern at the end of an uptrend, signaling a bearish reversal. After the Topping Tail candle is formed, place a short order a few pips below the low of that candle (short @ 1.2725), with a protective stop a few pips above that candle's close (@ 1.2747), and an objective at a previous resistance from two days ago which is expected to become support (@ 1.2678). In this example, this trade would turn out a profit of 47 pips with a 1:2 risk /reward ratio.
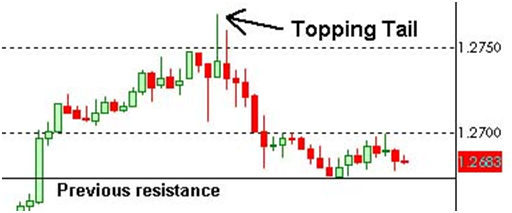 Figure 7
Some Key Continuation Patterns
Rising Three Methods

Falling Three Methods

A bearish continuation pattern. A long red body is followed by three small green candles, each fully contained within the range of the high and low of the first candle. The fifth candle closes at a new low.

A long green candle followed by another green candle that has gapped above the first one. The third candle is red, and opens within the body of the second candle, then closes below the previous candle's open, but does not close the gap.
Downside Tasuki Gap

A bearish continuation pattern. A long red candle followed by another red candle that has gapped below the first one. The third candle is green, and opens within the body of the second candle, then closes above the previous candle's open, but does not close the gap.
Real Chart Example of Continuation Patterns
Textbook-perfect examples of candle continuation patterns are very rare in Forex charts. Upside or Downside Tasuki Gap patterns are rarely appear because currency prices seldom gap.
Figure 8 shows a daily chart of CAD/JPY, with a Falling Three Methods pattern (circled) in the middle of a downtrend, signaling a trend continuation. Although the shadow of the third green candle exceeds the daily range of the first red candle, its body is contained within the first red candle's body. Place a short order a few pips below the low of the first red candle after the pattern completion.
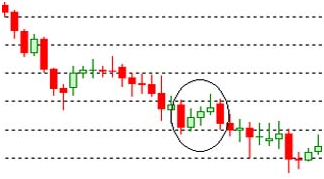 Figure 8
Trading Tips for Candlestick Patterns
- Candlestick patterns can be notoriously unreliable in short-term charts. They are far more reliable in daily, weekly or monthly charts.
- Use candlestick patterns in conjunction with other chart or indicator-based patterns for better results.
- Don't trade every candle pattern that you spot in the Forex chart
- Make sure your trade agrees with market sentiment as well.
Top Trading Strategy : Tag: Top Trading Strategy, Forex : candlestick charts, candlestick patterns, candlestick charting techniques, Reversal patterns, Continuation patterns - JAPANESE CANDLESTICK CHARTS - HOW TO READ CANDLESTICK CHARTS?