How to Trade Support and Resistance Breakout Strategy - TheForex7
Support and resistance, Support and resistance indicator, Support and resistance forex, Support and resistance level, Support resistance indicator, Support and resistance pdf
Course: [ Top Trading Strategy ]
Support and resistance form the basis of all technical chart formations. Support represents an area where there is more enthusiasm for demand, which is sufficient to stop a decline at least temporarily. Resistance represents an area where there is more enthusiasm for supply, which is sufficient to stop an advance at least temporarily.
Support and Resistance
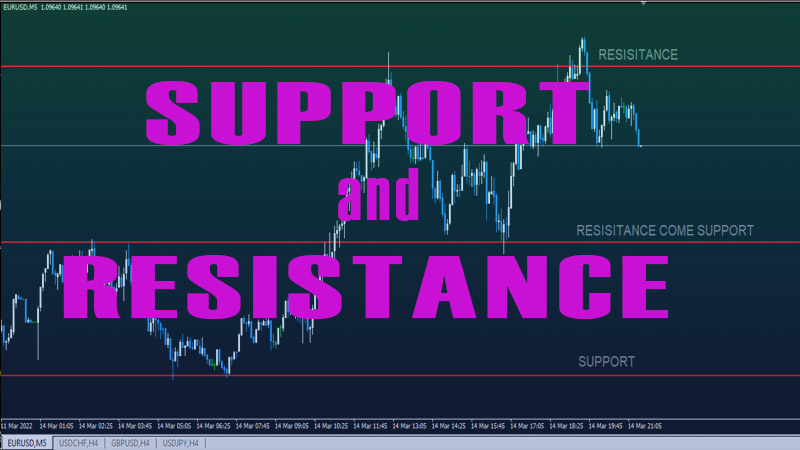
What Are Support and Resistance?
Support and resistance form the basis of all technical chart
formations.
Support represents an area where there is more enthusiasm
for demand, which is sufficient to stop a decline at least temporarily.
Resistance represents an area where there is more enthusiasm
for supply, which is sufficient to stop an advance at least temporarily.
It is important to note that supply and demand are always
equal. When an amount of currency is sold, that same amount will be bought, and
vice versa. When there is more enthusiasm for demand, it means that buyers are
much more bullish than sellers are bearish, and so are more willing to buy at
higher prices. This aggressive bidding action will then fulfill a price level as
support. On the other hand, when there is more enthusiasm for selling, it means
that sellers are much more bearish than buyers are bullish, and so are more
willing to sell at lower prices.
It helps to visualize support as a floor and resistance as a
ceiling.
Why Are They Important?
Previous support, when broken, becomes future resistance.
Previous resistance, when broken, becomes future support.
Once a support area has been violated on the way down, it
later becomes resistance on the way up. The textbook reason behind this is that
people who have bought at the support level earlier on saw their positions
going against them when the prices went down, and now that the price has gone
up again to the point where they bought, they took this opportunity to sell and
close their positions. The selling pressure at this point is what makes the
previous support a resistance now.
The same goes for resistance. Once a resistance area has
been violated on the way up, it later becomes support on the way down.
However, in the real world of trading, theories of support and resistance work as a result of a self-fulfilling prophecy since so many Forex traders know that these levels will be noted by many other players.
How to Use Support and Resistance in Forex Charts?
As entry points:
- Buy near support level on bullish market sentiment
- Short near resistance level on bearish market sentiment
- Trade (short) the breakout from the support level if the market sentiment is bearish, but not necessarily short from this price support
level ( take note of moving averages, Fibonacci levels, etc).
- Trade (long) the breakout from the resistance level if the market
sentiment is bullish, but not necessarily long from this price resistance level
( take note of moving averages, Fibonacci levels, etc).
As exit points:
- Place your objective for a short position near a support
level
- Place your objective for a long position near a resistance
level
When a currency pair is
consolidating, and you don't expect any significant news to sway its direction,
it can be very profitable to buy bounces off support and to short sell at
resistance and are low-risk ways to base your trades on. It helps to think of
support and resistance as price areas, rather than specific price points since
they may range from a few pips to more than 10 pips sometimes.
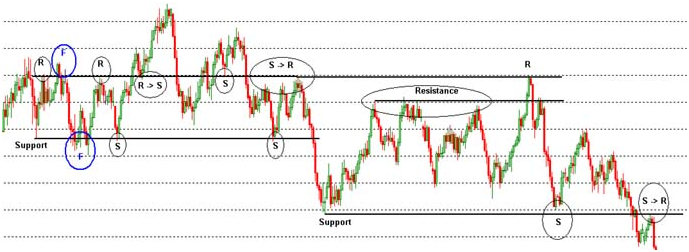
Real Chart Example
 Figure
1
Figure
1
Figure 1 above shows a daily chart of NZD/USD with bold lines indicating support or resistance levels. The letter R marks resistance; Smarks support; F (circled blue) marks false breakouts on the chart. R -> Smarks previous resistance turned into support, whereas S -> R marks previous support turned into resistance. As you can see, support and resistance levels often switch their roles once they are penetrated.
Where They Can Be Found in Forex Charts
There are some guidelines for identifying potential support
or resistance zones on currency charts:
- Round
numbers of prices. Prices ending with '00' as the last 2 digits are strong
psychological zones, for example, 1.2400. or 118.00. For prices that end
with '000' as the last 3 digits, they are even stronger psychological
zones than those with just 2 zeros as the last digits, for example,
1.1000, 1.2000, 1.3000. Prices will often move a bit beyond or fail to
reach the actual numbers, so it is better to see them as zones rather than
specific points. Mid-price levels are of particular significance, for
example, 1.2500 for EUR/USD and USD/CHF, because it is where the crossover of
their prices occurs.
- Previous
daily highs or lows have a good tendency to become support or resistance
zones. Intraday highs or lows are not as accurate as daily ones.
- Trendlines
and moving averages are in fact dynamic support and resistance levels. In
the case of an uptrend, it makes logical sense to place a buy order when
the price declines to the trendline area. It is considered a low-risk
trade if other chart indicators and market sentiment agree with the
uptrend because you can place your stop below the line. Your stop will be
hit if this support area becomes violated.
- Retracement
levels as indicated by Fibonacci may serve as future support or
resistance.
Significance of Support and Resistance
How can you determine how strong support or resistance can
be? Here are several guidelines:
- The
more times a zone has been able to stop and reverse a price trend, the
more significant that zone becomes as a support or resistance. If a
currency price has bounced off the support zone a few times, people will
become accustomed to that zone as a support, and hence there will be more
buying pressure to rally the price. A support or resistance zone in a
daily or weekly chart will be much more significant than one that is on an
hourly or less chart, because the longer the zone has been established as
such, the more obvious it becomes to people. In the case of a support
level, since most buyers would place their stops below it, and when this
support becomes violated, the momentum for a downtrend becomes very strong
as more stops below it are being triggered.
- The
faster the price moves towards the support or resistance zone, the more
significant that zone will be. If prices have been falling sharply towards
a support area as compared to moving downward steadily, the more
significant the support area becomes.
- The
longer the time that has elapsed since the last time the zone acted as a
support or resistance, the less significance it is likely to have. A
support that was established a decade ago would be less significant than
one that was formed 6 months ago.
Trading Tips
- It
is not wise to buy at support if you see that a downtrend is very strong,
especially one that is driven by strong market sentiment and bias. In any
case, always have a tight stop below the support level.
- However, if the support level is a very major one, there is a chance that the downtrend might rebound - but maybe only for a short while. The same goes for short at resistance.
Top Trading Strategy : Tag: Top Trading Strategy, Forex : Support and resistance, Support and resistance indicator, Support and resistance forex, Support and resistance level, Support resistance indicator, Support and resistance pdf - How to Trade Support and Resistance Breakout Strategy - TheForex7