Dow Jones Industrial Average
dow jones, dow jones today, dow jones live, dow futures, dow jones index
Course: [ Harmonic Elliott Wave : Chapter 7: A Case Study in EURUSD ]
Elliott Wave | Forex | Fibonacci |
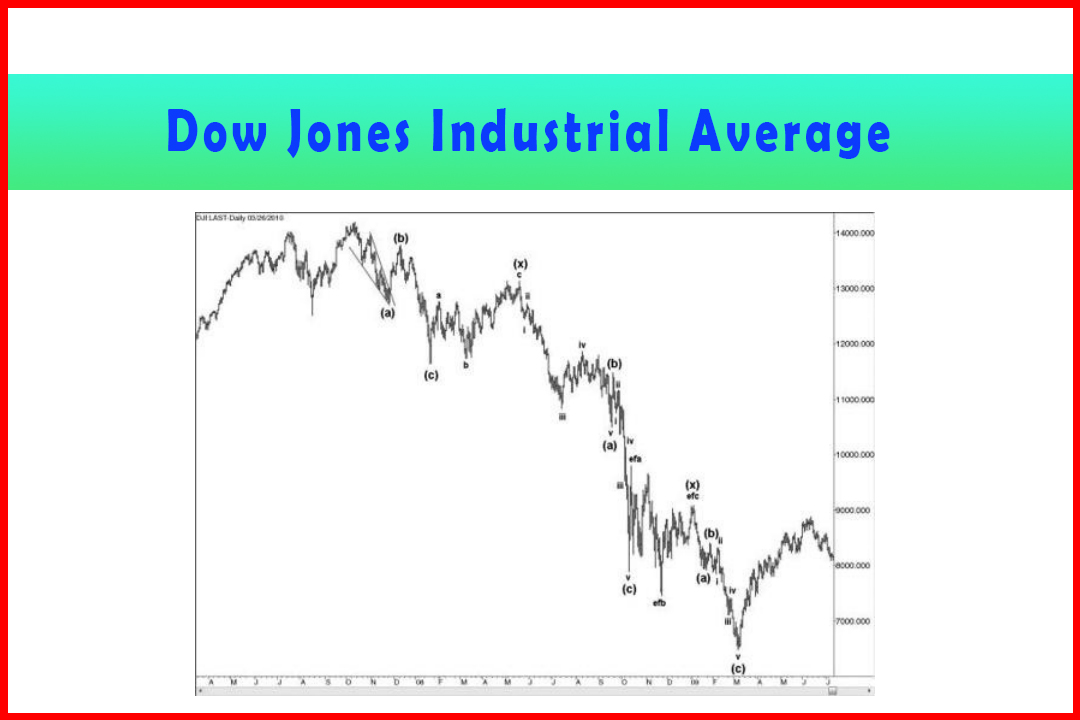
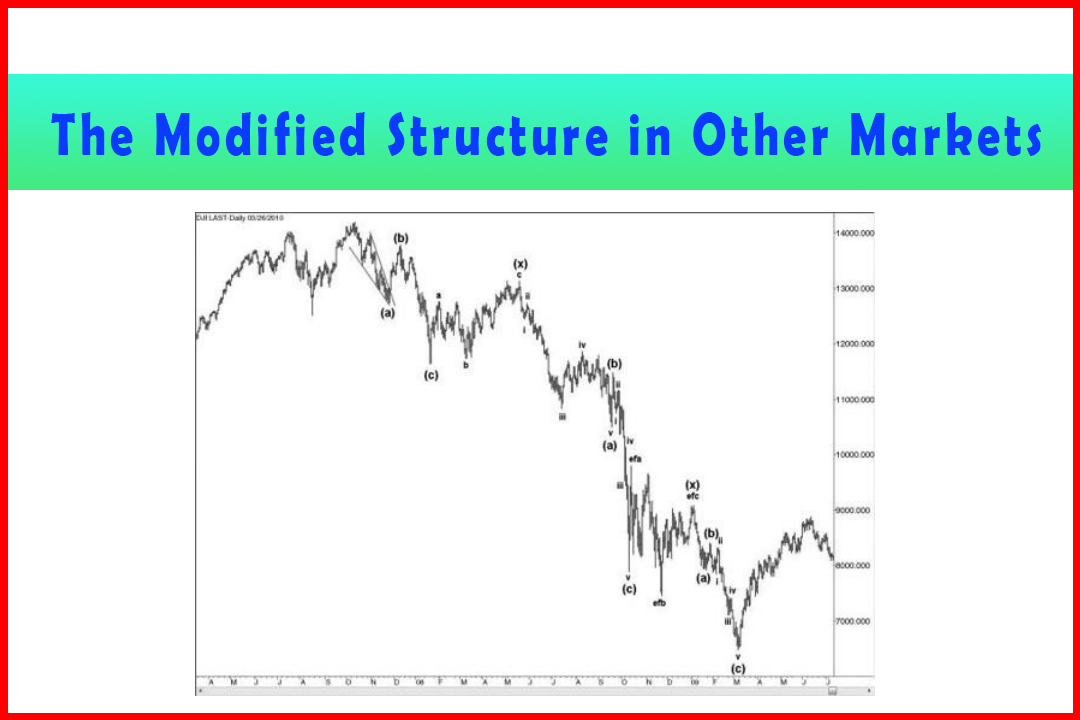
A first choice must naturally be a major stock index, and given the turmoil over the past two years I have taken a look at the Dow Jones Industrial Average (DJIA) to try to ascertain whether the decline from the 14,198.10 high was merely a correction or whether there are further losses to come.
Dow Jones Industrial Average
A first choice must naturally be a major stock
index, and given the turmoil over the past two years I have taken a look at the
Dow Jones Industrial Average (DJIA) to try to ascertain whether the decline
from the 14,198.10 high was merely a correction or whether there are further
losses to come.
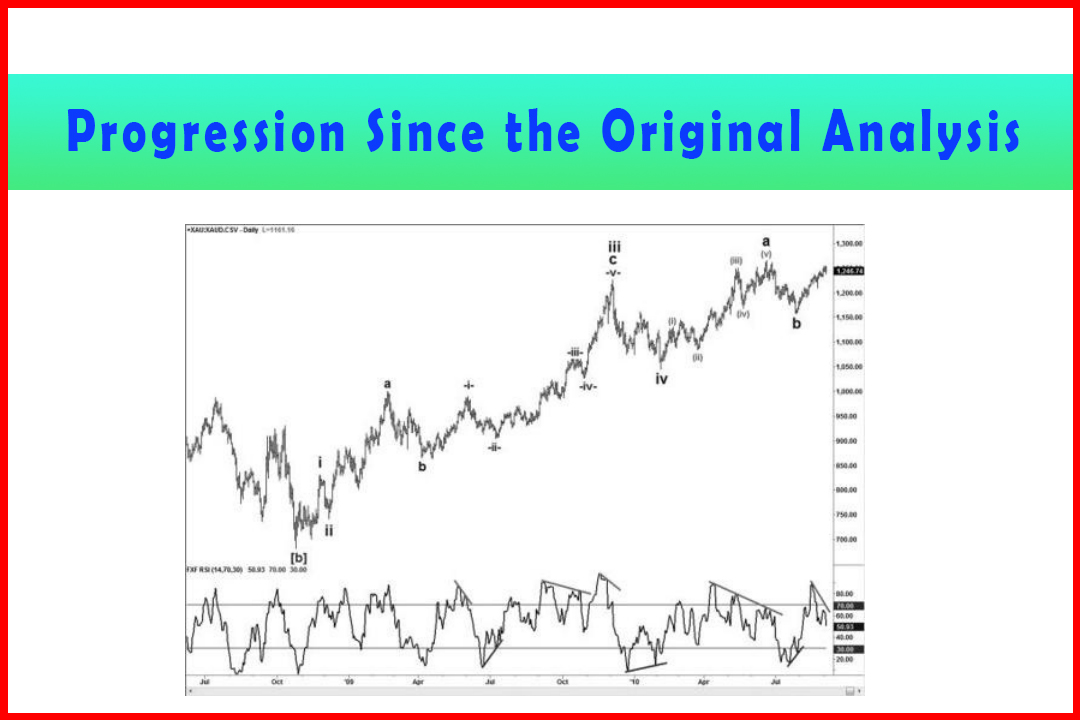
I have chosen the daily chart (Figure 7.1) to
highlight what I feel is the likelihood that the entire decline from the peak
was a complete correction and not just a complex correction that could keep it
trading in a range for some years. I have counted this as a Triple Three which
therefore implies the next larger move will be a rally that will reach new
highs. I did find that some ratios were not quite as precise as I have found in
the forex markets, but the vast majority of projections and retracements were
within a reasonable variance of the calculated levels (Table 7.1).
Figure 7.1 DJIA Decline from the 14,198.10 High in a Triple Three
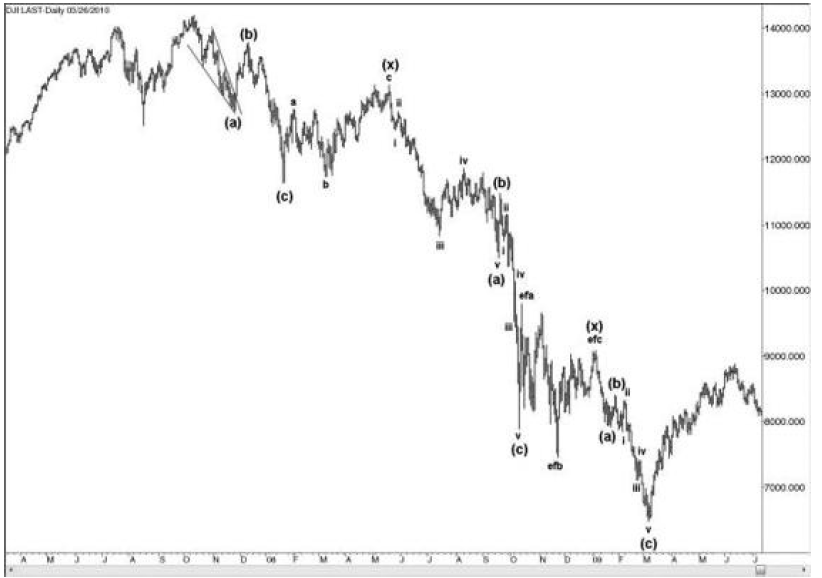
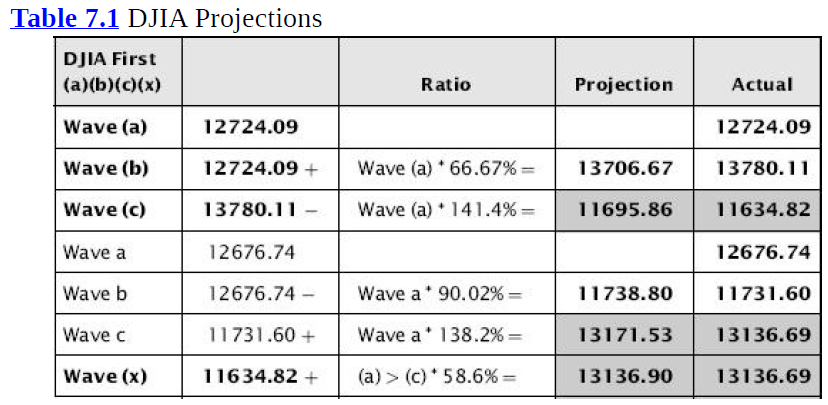
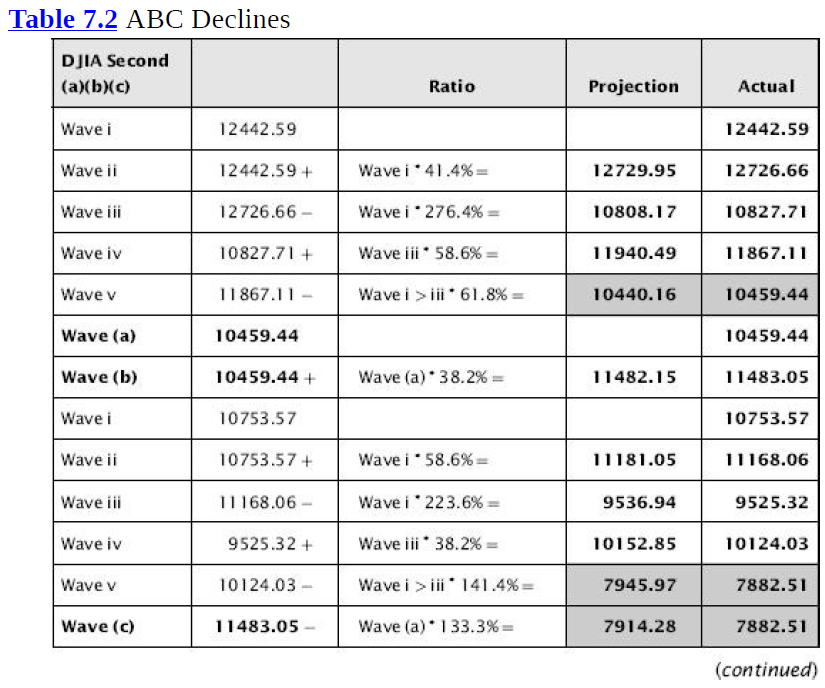
The first ABC decline worked quite well, although the 141.4% projection in Wave (c) has never been a common ratio seen in Wave (c). However, the 58.6% retracement in Wave (x) is very common and came close to the actual final stalling point.
Table 7.2 lists the next two ABC declines.
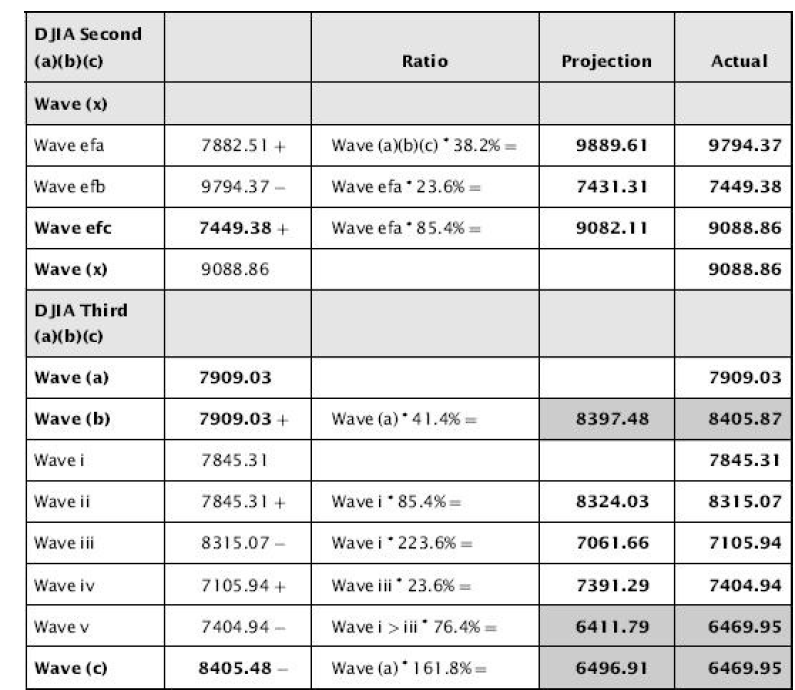
The rest of the ratios were quite convincing to
me that the index has seen a Triple Three, and thus overall we should be
looking for a new high at some point.
Harmonic Elliott Wave : Chapter 7: A Case Study in EURUSD : Tag: Elliott Wave, Forex, Fibonacci : dow jones, dow jones today, dow jones live, dow futures, dow jones index - Dow Jones Industrial Average
Elliott Wave | Forex | Fibonacci |