Wheat Futures
Equity market, Best Trading Strategy
Course: [ Harmonic Elliott Wave : Chapter 7: A Case Study in EURUSD ]
Elliott Wave | Forex | Fibonacci |
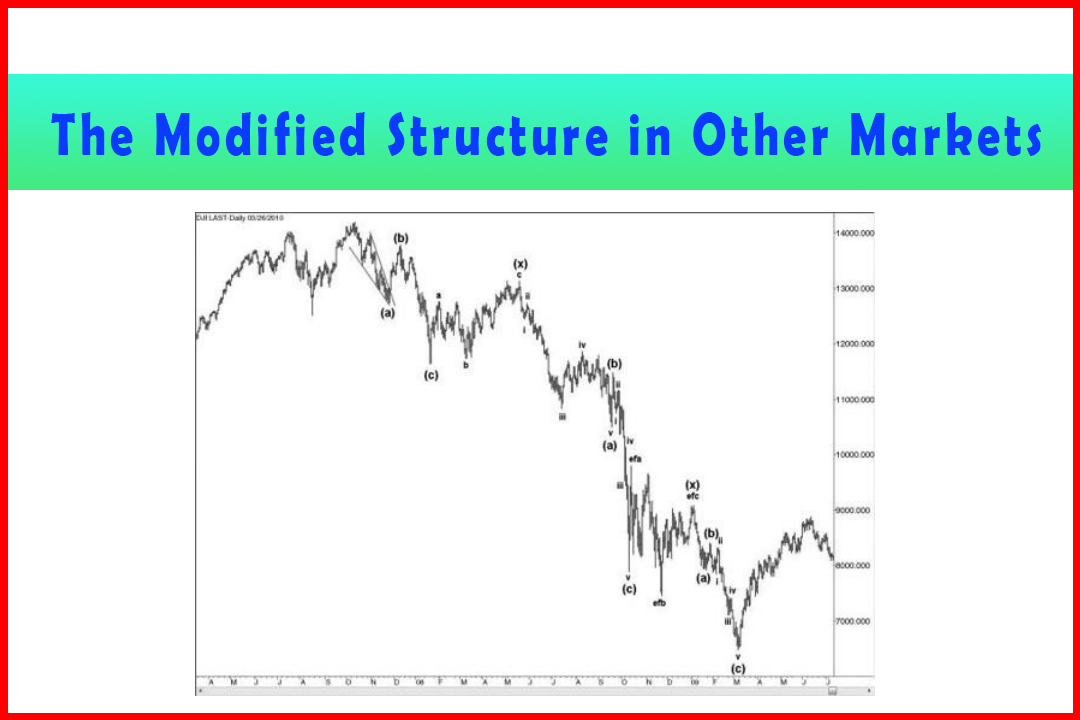
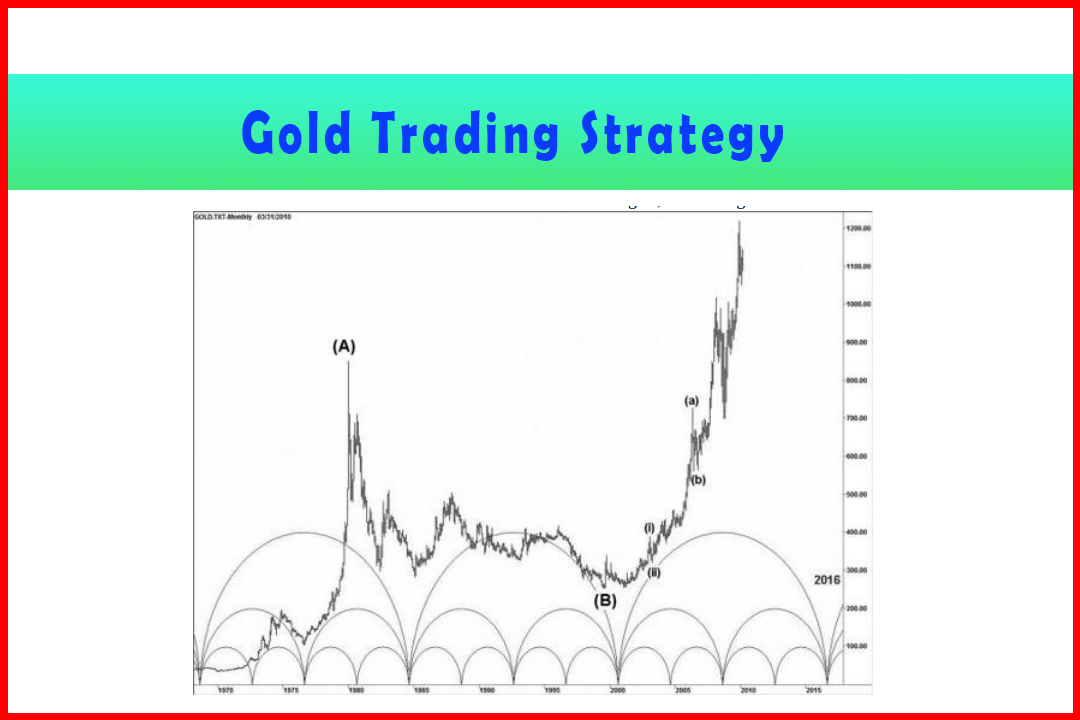
To include an example of a commodity future I was able to obtain the history for wheat futures. This is still what I feel is probably an incomplete decline as it has mapped out a three-wave decline in the weekly chart thus far which I feel completes only Wave (iii).
Wheat Futures
To include an example of a commodity future I
was able to obtain the history for wheat futures. This is still what I feel is
probably an incomplete decline as it has mapped out a three-wave decline in the
weekly chart thus far which I feel completes only Wave (iii).
Figure 7.16 displays a decline in the wheat
futures contract that looks very much like having generated Wave (iii) of Wave
(C) lower. Table 7.20 shows the wave relationships.
Figure 7.16 Decline to Wave (iii) in the Weekly Wheat Future Contract
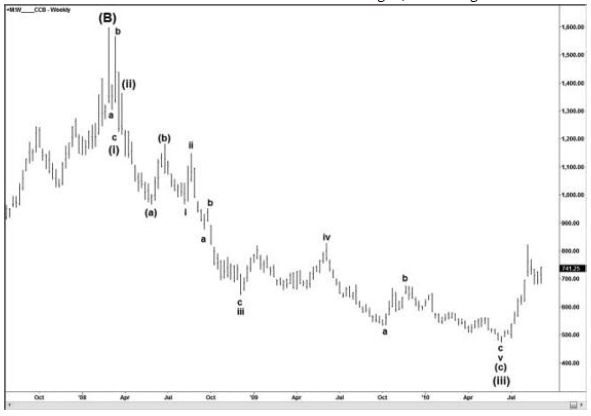
Table 7.20 Wave Relationships for Figure 7.16
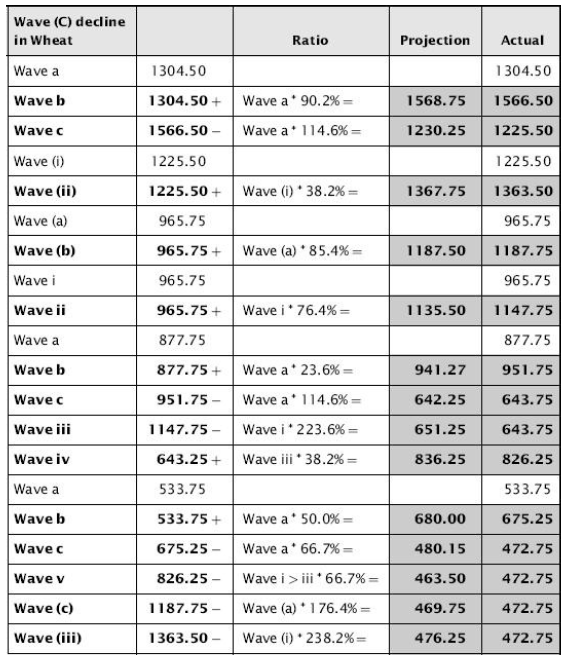
From this table it can be seen that the
wave relationships are generally represented by harmonic relationships, and the
variances between the exact ratios and the actual stalling points are also
quite close.
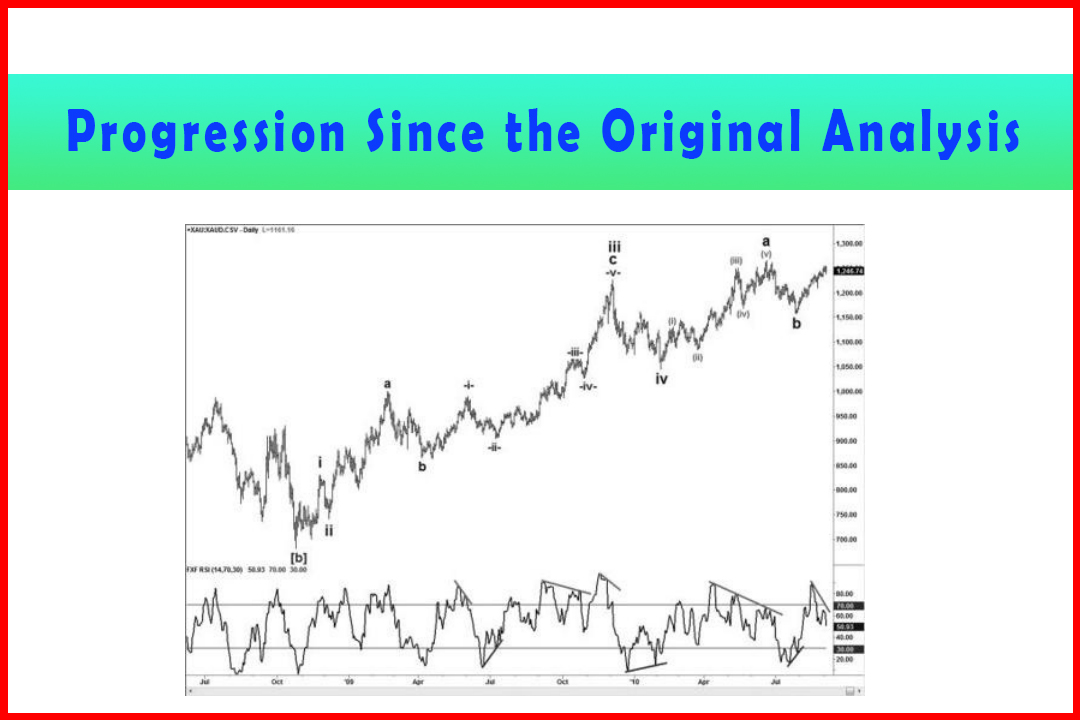
Following this decline, price has recovered to
822.25, and I note the ideal 50% retracement in Wave (iv) would imply a
corrective peak close to the 918.00-25 area. In turn, this type of Wave (iv)
peak would imply a minimum target of a 50% projection at 355.75 with the 61.8%
projection at 222.75. At this point I do not have the peak of the original high
and cannot match this with a projection of the original Wave (A), which would
help to identify a most likely area where the decline will stall.
Harmonic Elliott Wave : Chapter 7: A Case Study in EURUSD : Tag: Elliott Wave, Forex, Fibonacci : Equity market, Best Trading Strategy - Wheat Futures
Elliott Wave | Forex | Fibonacci |