French CAC 40 Index
Equity market, Best Trading Strategy
Course: [ Harmonic Elliott Wave : Chapter 7: A Case Study in EURUSD ]
Elliott Wave | Forex | Fibonacci |
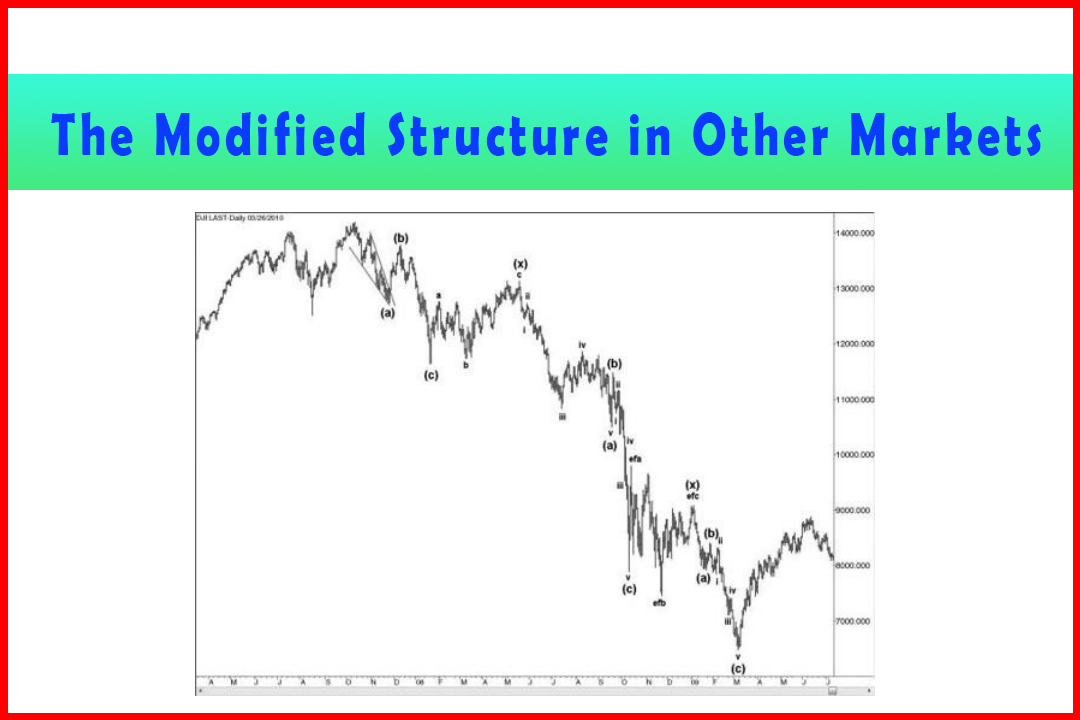
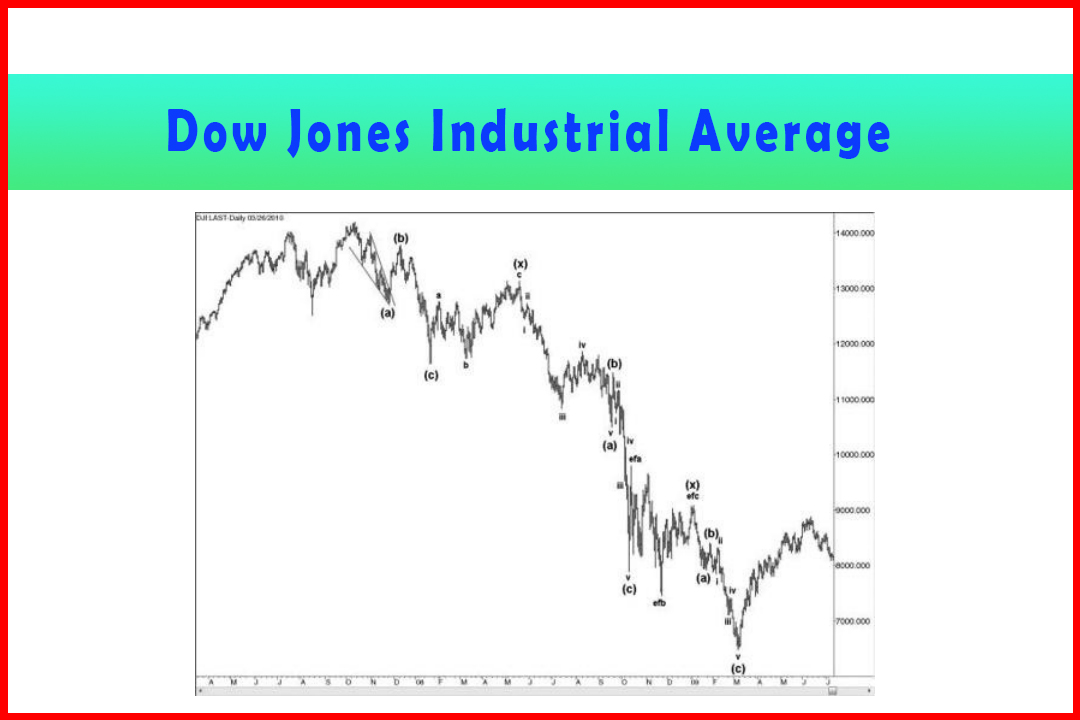
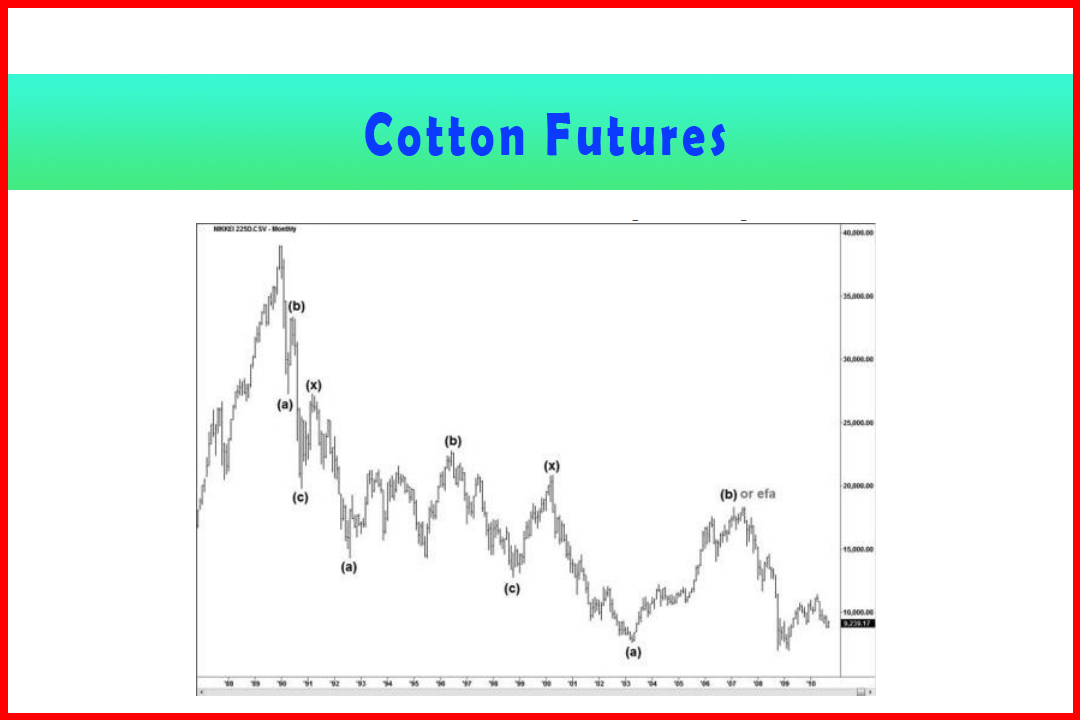
I'd like to add two more examples of equity markets, starting with the French CAC 40 Index, just to provide more than a single equity market. However, there is still the final forecast for this which may or may not occur, but by the time this book is published the result will be known.
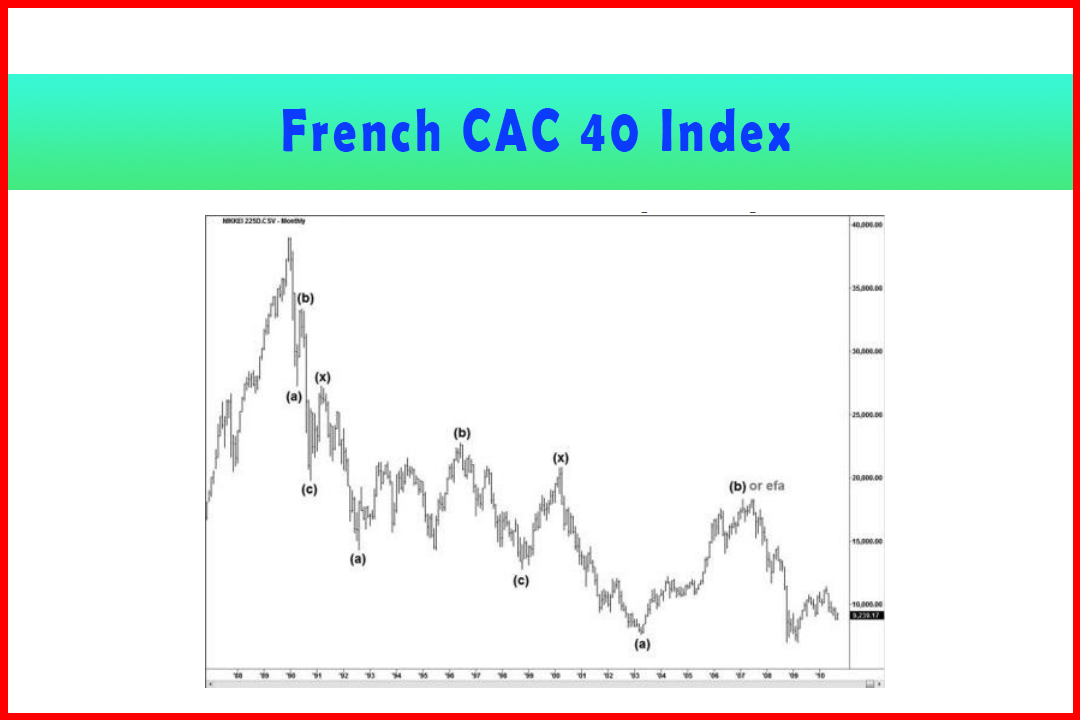
French CAC 40 Index
I'd like to add two more examples of
equity markets, starting with the French CAC 40 Index, just to provide more
than a single equity market. However, there is still the final forecast for
this which may or may not occur, but by the time this book is published the
result will be known. I will highlight the key break areas that would render my
forecast as incorrect.
In Figure 7.13 the French CAC 40 Index is
displaying what appears to be a weekly Zigzag lower from the September 2000
high at 6,944.77.
Figure 7.13 An Incomplete (a)(b)(c) Decline in CAC 40 Index
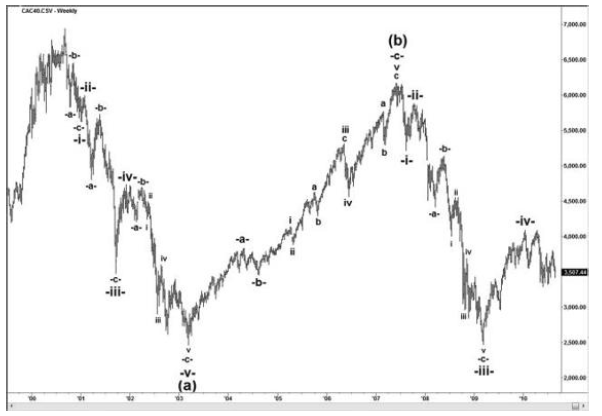
At this point I find it hard to conceive any
other wave count, with the decline to Wave -iii-in Wave (c) having stalled just
64.00 above Wave (a) and the pullback in Wave -iv-being just a little less than
50% of Wave -iii-. Still, this outlook needs to be confirmed and only time will
tell. The following tables provide the wave relationships in the three legs.
As shown in Table 7.13, there are some quite
accurate relationships in the Wave (a) decline and some not quite so accurate,
but overall the general correlation of target levels, in particular the final
2,401.15 low, is quite convincing. Where perhaps there are more mild deviations
from normal ratios is in the corrective waves, but that is not an uncommon
observation. The correction in Wave -ii-of Wave (a) generated a difference of
50.0 between the 33.3% retracement and final stalling point, but still only
represented less than a 1% deviation. In Wave -c-of Wave -v-there were also two
other instances of a 50.0 difference between the final result and closest
normal retracement/projection. However, overall I feel this does represent a
solid reflection of the harmonic structure.
Table 7.13 Decline in Wave (a) in the CAC 40 Index
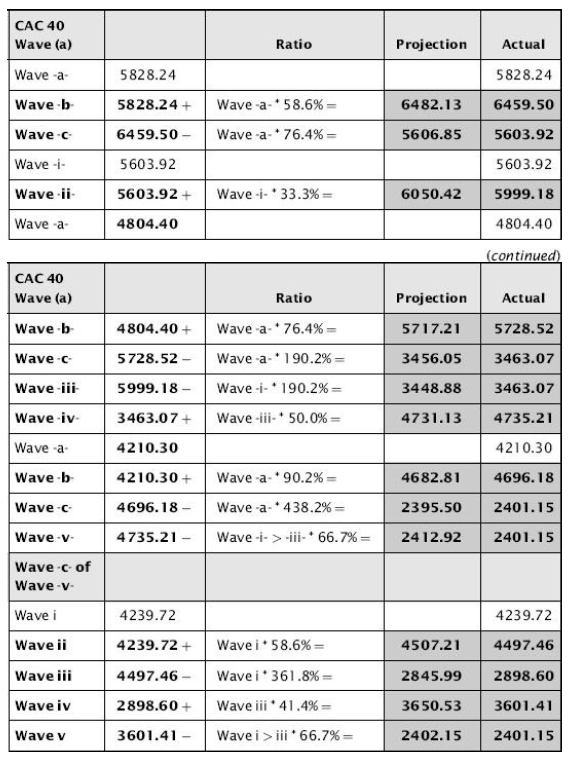
As shown in Table 7.14, the Wave (b) correction
was very deep, just short of an 85.6% retracement. Again, I can't say
the relationships developed with the level of consistency I prefer to see, but
without any doubt this was a correction and should therefore be labeled as a
Wave (b).
Table 7.14 Correction in Wave (b) in the CAC 40 Index

The decline in Wave (c) has been constructive,
and I feel the weight of evidence does still point to a new low that should be
in place by the time this book is published.
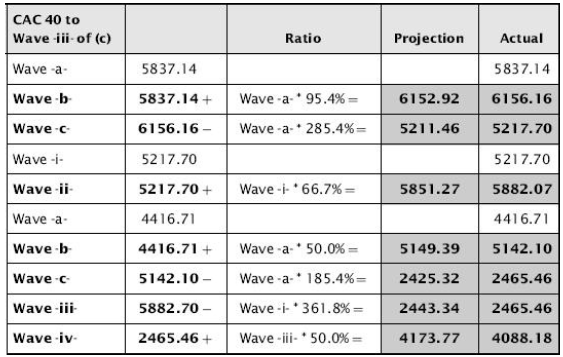
As shown in Table 7.15. again while the wave
relationships aren't particularly spot-on, the projection in what I
feel is Wave -iii-and pullback in Wave -iv-appear quite convincing. I feel
there is still a small risk of a slightly deeper retracement in Wave -iv-since
the full 50% retracement was not met, but the balance of the rough 66.7%
retracement in Wave -ii-and the mild shortfall in the 50% retracement in Wave
-iv-do tend to complement each other in terms of alternation.
Table 7.15 Decline in Wave (c) in the CAC 40 Index
Should the current Wave -iv-high at 4,088.18
remain intact, as I feel it may, then a 66.7% projection in Wave -v-will target
the 1,618.49 area. Equally, a wave equality target implies a target at
1,624.53, which is obviously very close.
If this outlook is incorrect then a break above
the 50% retracement in Wave - iv-at 4,173.77 and the 58.6% retracement at
4,467.59 would imply a deeper recovery that would require an adjustment to the
entire structure.
Harmonic Elliott Wave : Chapter 7: A Case Study in EURUSD : Tag: Elliott Wave, Forex, Fibonacci : Equity market, Best Trading Strategy - French CAC 40 Index
Elliott Wave | Forex | Fibonacci |