Gold Trading Strategy
How to trade gold, Trade Gold, Best trading strategy
Course: [ Harmonic Elliott Wave : Chapter 7: A Case Study in EURUSD ]
Elliott Wave | Forex | Fibonacci |
I was asked by a subscriber about my view of gold in August 2009. This was the first time I had looked at a gold chart in many years, and therefore obviously the first time I offered any opinion on gold.
Gold
I was asked by a subscriber about my view of
gold in August 2009. This was the first time I had looked at a gold chart in
many years, and therefore obviously the first time I offered any opinion on
gold. I have to say that I was not prepared for what I found, or at least what
I thought I found, in the wave structure. It is still a wave count that I look
at and think, “Is this really correct?”
At that time my first target was between
$1,215.64 and $1,221.00. The high for this move came in at $1,218.40, so I am
cautiously encouraged by the development but I still remain somewhat cautious
since, as you will see from the structure, it does look quite unusual.
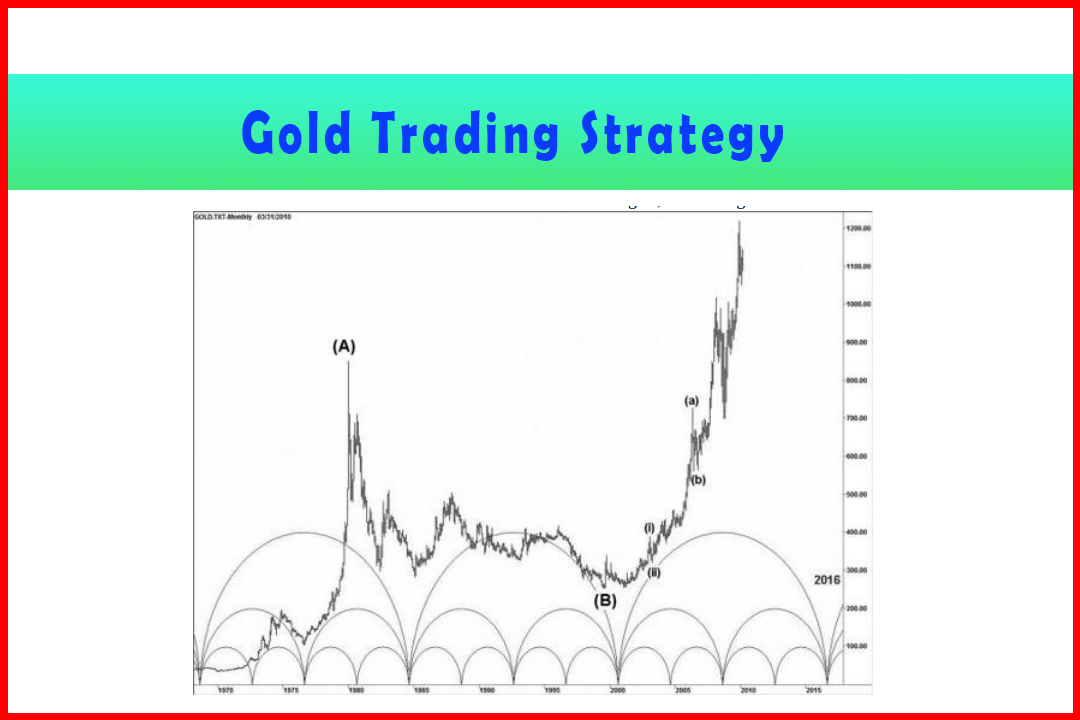
Firstly, to get a larger perspective I provide
the monthly chart (Figure 7.8).
Figure 7.8 Monthly Gold with Underlying Cycles
Since I only have data back to around 1970 I
cannot be 100% certain of the wave count. However, there does seem to be logic
in the current rally being a Wave (C). I have also placed on this chart what I
consider to be a sound cyclic representation that seems to match with the major
price lows. I suspect the next larger cycle low occurred around the Wave (B)
low. This would then imply a strong major up-cycle and why we are still seeing
gains at the top of the largest displayed cycle which next finds a low in 2016.
That should mean that there is probably another two to three years (to
2012-2013) in the current up-cycle before a substantial correction.
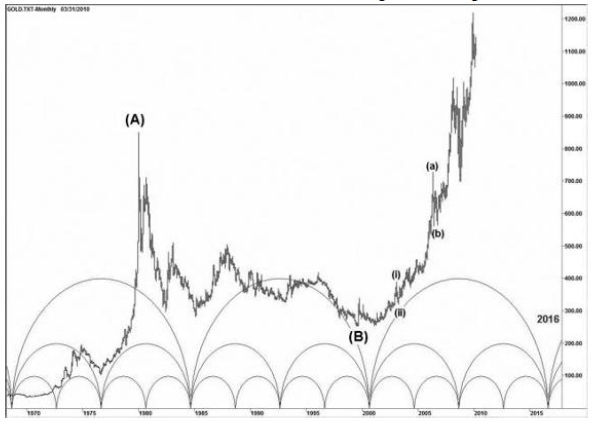
In viewing this I am making a mental note that
the anticipated 2012-2013 cycle high may only be the end of a major third wave
with the 2016 low being the fourth. This would imply that the marked Wave (A)
and Wave (B) may only be those within a larger Wave (III).
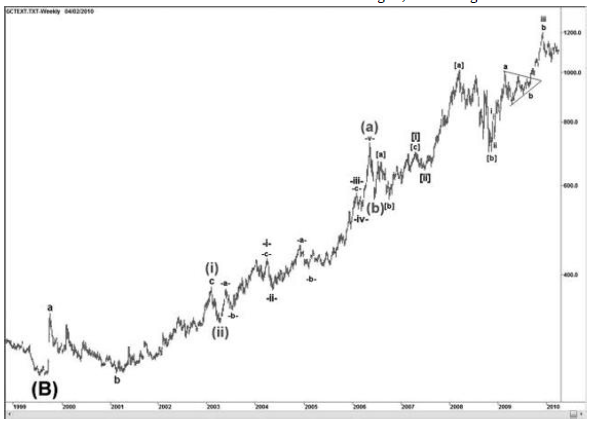
In adhering to the modified harmonic wave
structure I found myself forced to look for an excessive projection in Wave
(iii), otherwise the wave count just didn't make sense. As you can see
in Figure 7.9, in August 2009 price had just poked above the Triangle and my
target was between $1,215.64 and $1,221.00. Although I was uncertain about the
structure that would make up the target in Wave [c] of Wave [iii], I have been
pleasantly surprised some seven months later when I updated the data that
everything has held together.
Figure 7.9 Weekly Gold Displaying an Unfinished Wave (iii) of Wave (C)
7.10 provides the ratios supporting the wave
count.
Table 7.10 Wave Relationships for Figure 7.9
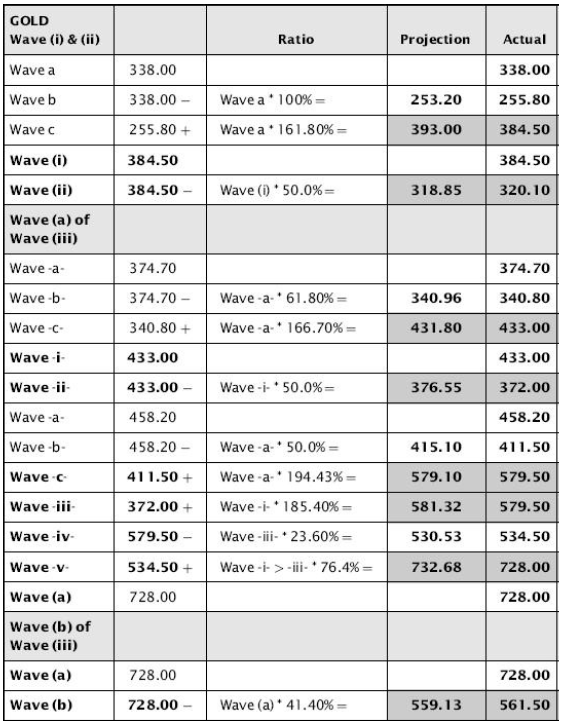
In all instances the wave relationships are very
similar to those I have found in the forex market, and the variance between
projections and actual rates are within an acceptable amount.
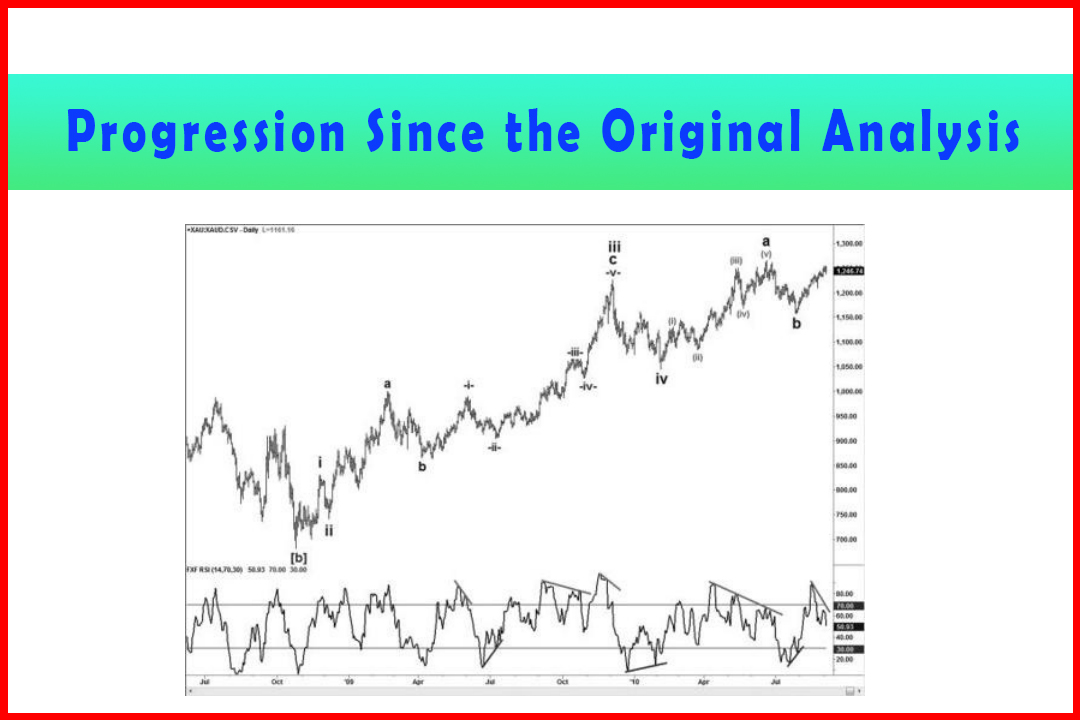
It is perhaps the Wave (c) of Wave (iii) under
development that requires a little more scrutiny with the deep Wave [b] of Wave
[iii]. For this I shall also provide the daily chart (Figure 7.10).
Figure 7.10 Daily Gold Displaying an Unfinished Wave [c] of Wave [iii] of Larger Wave (iii)
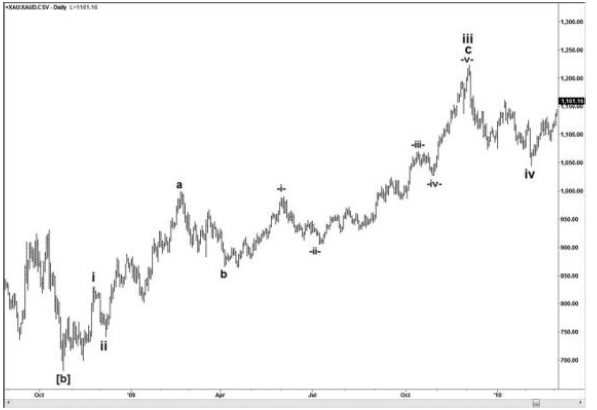
Table 7.11 shows the wave relationships.
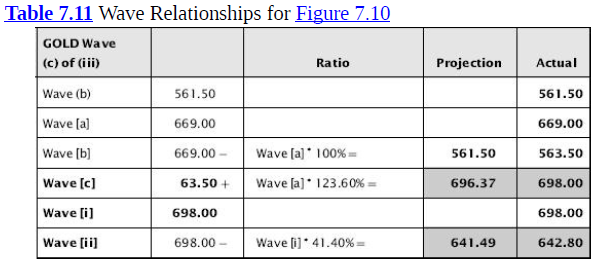
The wave relationships work well, although there
are two ratios that make me slightly nervous. The 85.4% retracement in Wave [b]
of Wave [iii] is very, very deep, and the 361.8% projection in Wave iii of Wave
[c] is likewise unusual but does work quite well.
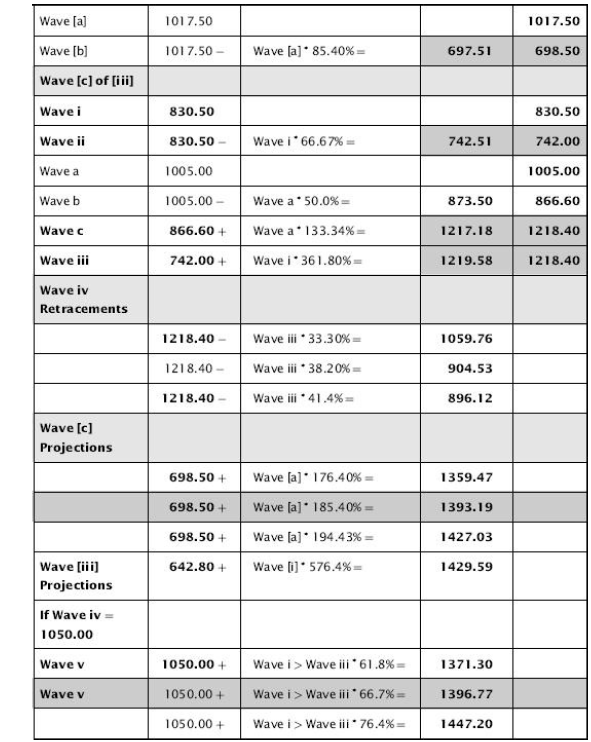
It is not yet clear whether the Wave iv
retracement is complete, although at 1,050.00 it was quite close to the 33.3%
retracement at 1,059.76. I have also offered tentative potential projections
for Wave [iii] and Wave v of Wave [c] which appear to point to the next target
being around 1,393-1,396. However, this does include a 576.4% projection in
Wave [iii], which again I am rather cautious about.
I have looked for an alternative count, but at
this point the ratios are more extreme than those shown above. In terms of the
wave count shown I am quite content with the implication of the target in Wave
[iii], which should then be followed by a rally in Wave [v] to complete Wave
(c) of Wave (iii).
Given the brief Wave (ii) and the fairly direct
rally in Wave (iii), it does imply a deeper and longer lasting Wave (iv) that
should finally allow a Wave (v) to develop in time for the anticipated cycle
high in 2012-2013.
Harmonic Elliott Wave : Chapter 7: A Case Study in EURUSD : Tag: Elliott Wave, Forex, Fibonacci : How to trade gold, Trade Gold, Best trading strategy - Gold Trading Strategy
Elliott Wave | Forex | Fibonacci |