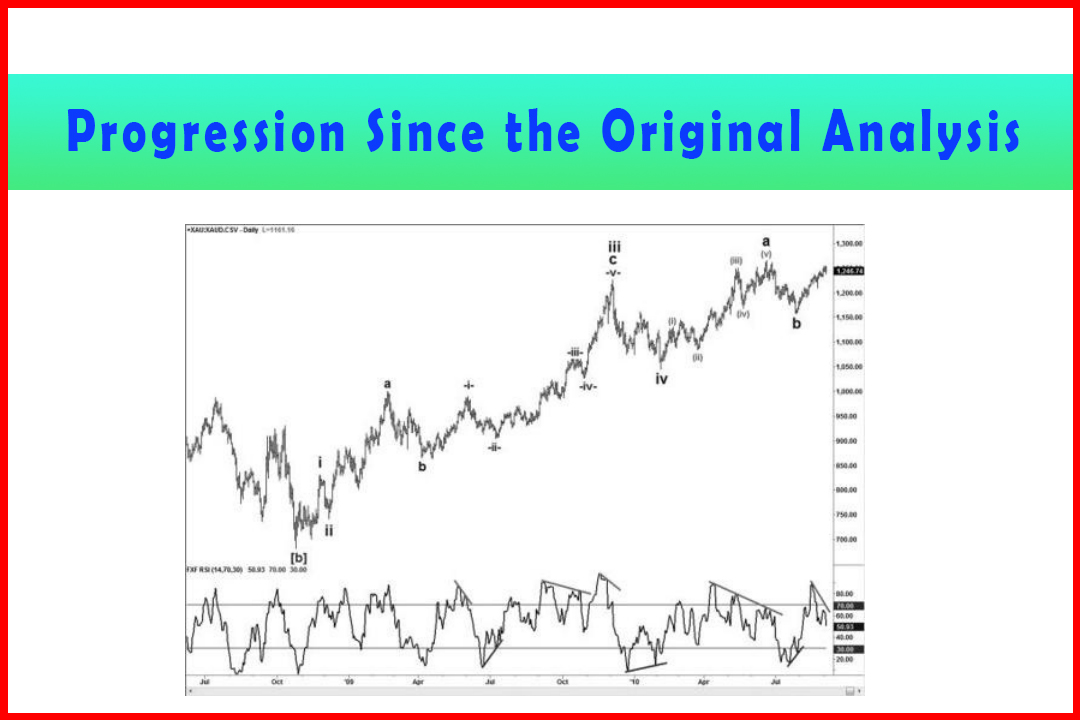
Monthly Chart from Inception
Best trading Analysis, Best Forecasting Analysis
Course: [ Harmonic Elliott Wave : Chapter 7: A Case Study in EURUSD ]
Elliott Wave | Forex | Fibonacci |
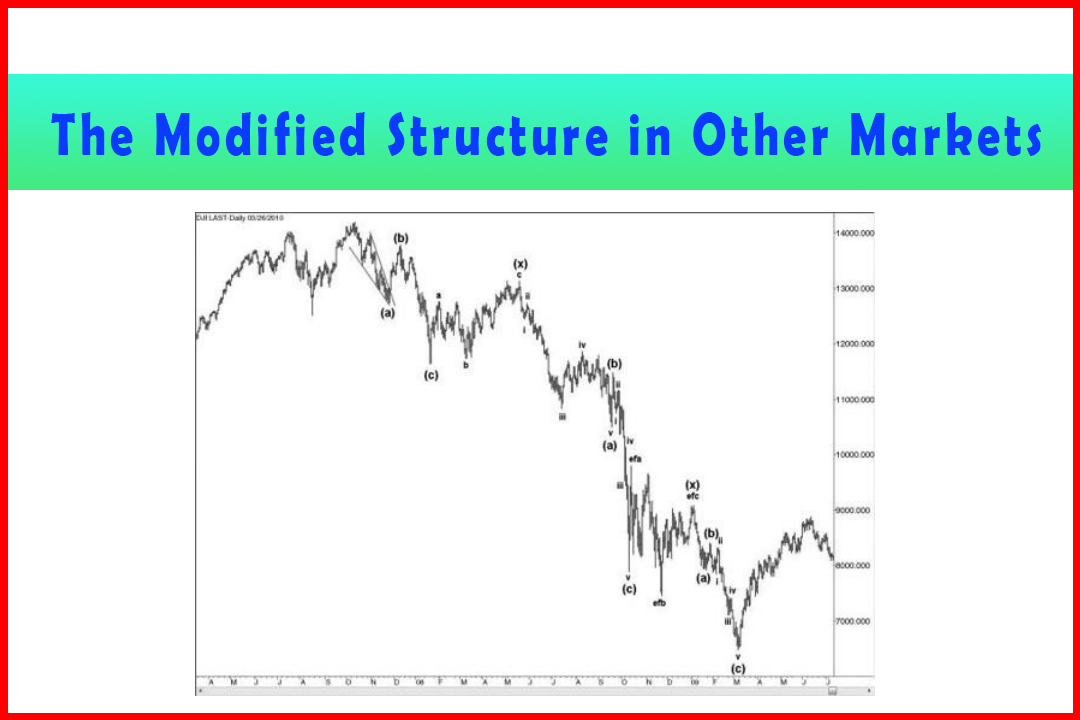
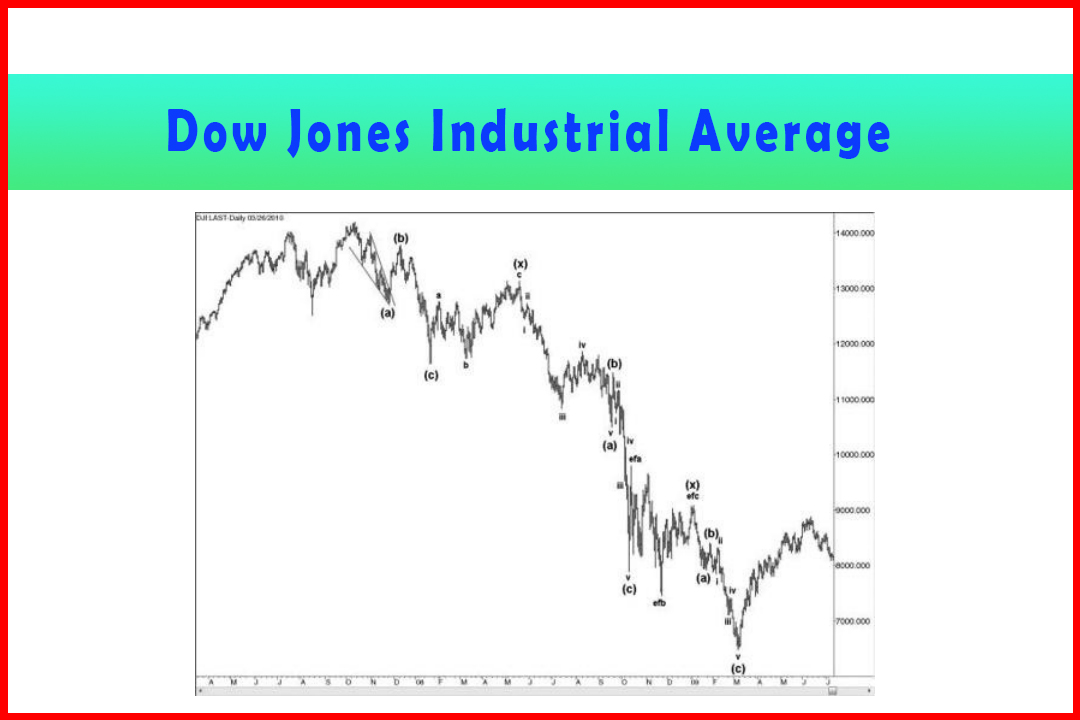
Having seen that the decline to the 6,469.95 low was corrective I was rather surprised. All I had been hearing were extremely pessimistic forecasts, plenty of doom and gloom, and how the index would remain subdued for perhaps a decade or more.
Monthly Chart from Inception
Having seen that the decline to the 6,469.95 low
was corrective I was rather surprised. All I had been hearing were extremely
pessimistic forecasts, plenty of doom and gloom, and how the index would remain
subdued for perhaps a decade or more. The prospect of new highs intrigued me,
and I knew I should include the analysis for the super-cycle picture. I have to
say that once again I was wondering what I would discover and had no real prior
expectation of what I would find.
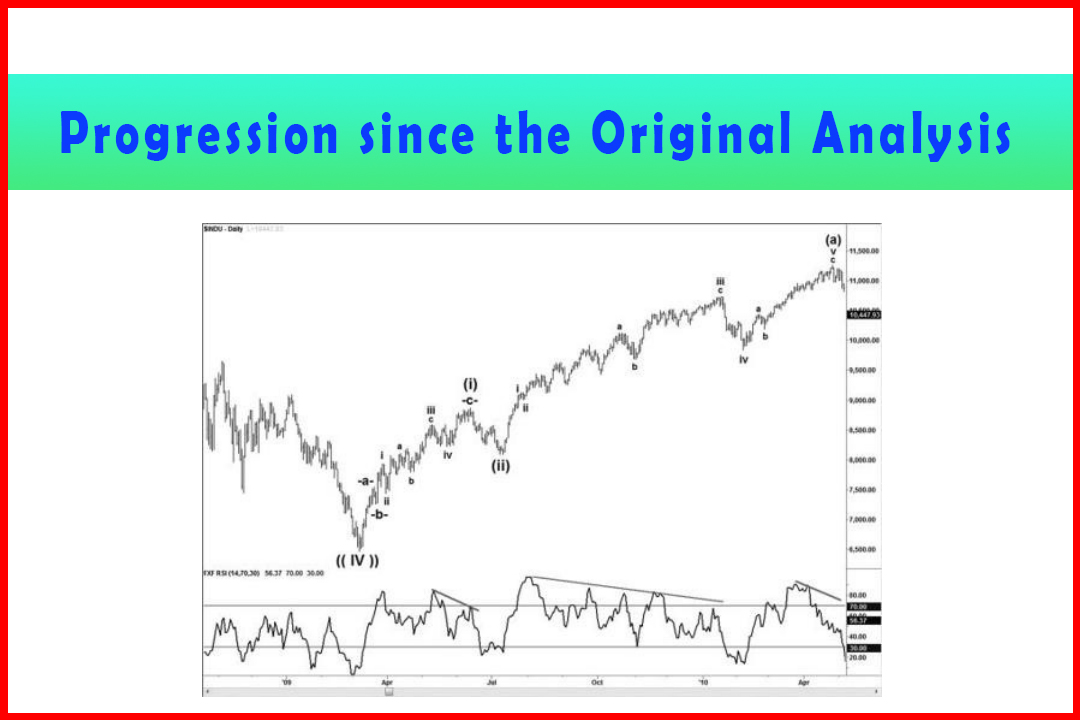
I found the result partly gratifying because the
monthly chart confirmed the harmonic structure and also that a new price high
is to be expected. However, I was rather shocked with the outcome.
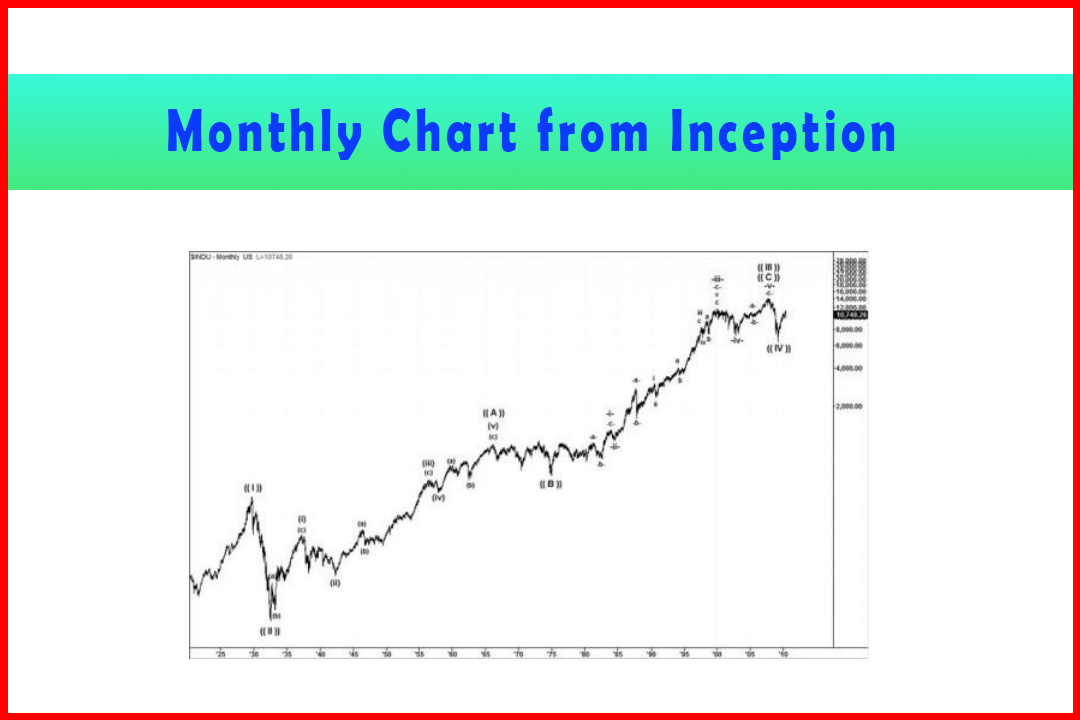
Figure 7.2 displays the monthly DJIA chart from
just before the 1930s crash. In looking at the chart for the first time with
harmonic glasses the remarkable clarity of the harmonic structure hit me
immediately. As much as I was convinced by merely eyeballing the chart, I
wanted to confirm this to ensure the projection ratios were valid and the projection
targets across the different wave degrees matched.
Figure 7.2 DJIA Rally from just before the 1930s Crash
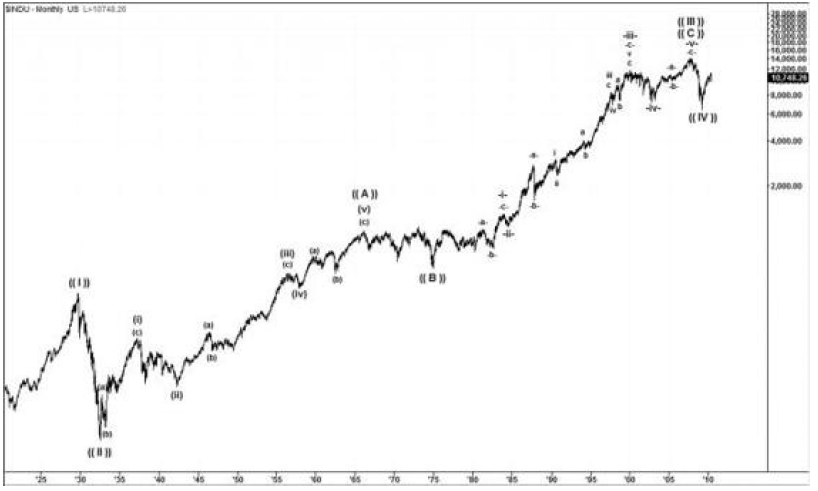
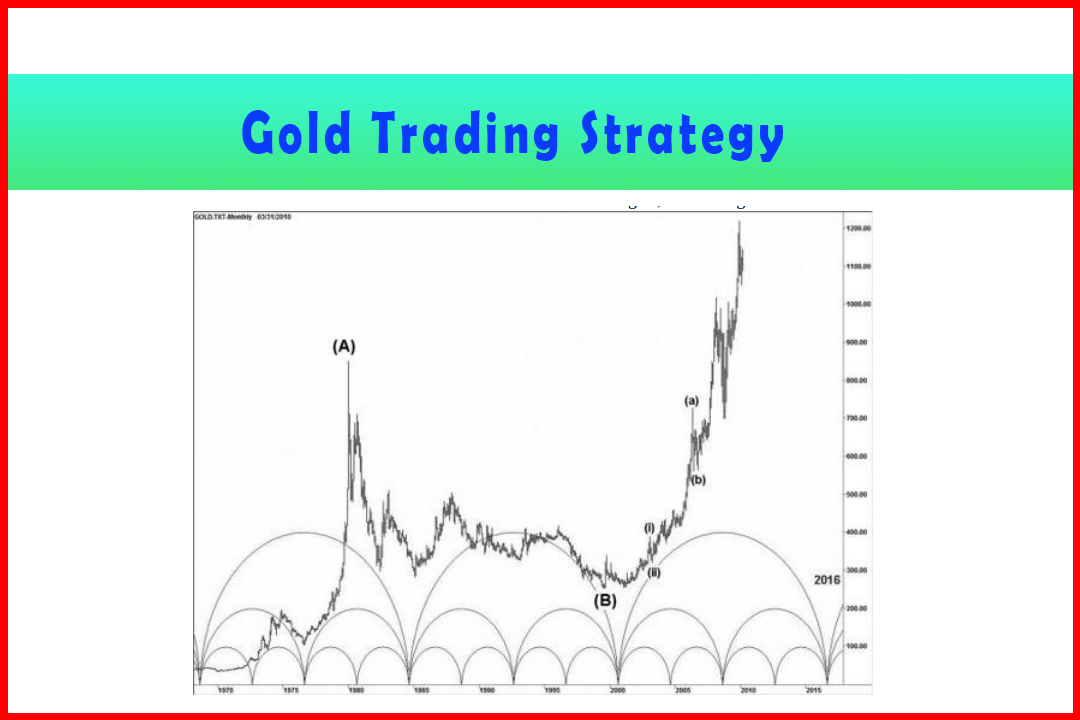
I had to decide on the starting value. I searched on the Internet and discovered that the first quotation for the DJIA wasn't until some time after Charles Dow compiled the original constituent members of the index. When this was quoted it was already above the 40.56 low that eventually occurred following the 1930s crash. Clearly it had to begin below 40.56, and I did discover a quote of 25.56. The accuracy is open to debate, but what I found is that in projecting a Wave ((III)) target the variance in projections with a starting value from as low as 10.00 made minimal difference to the final targets.
My findings imply that the 14,198.10 high is
only Wave ((III)) while the correction in Wave ((IV)) was just over a 50%
retracement of Wave ((III)). Table 7.3 shows the ratios.
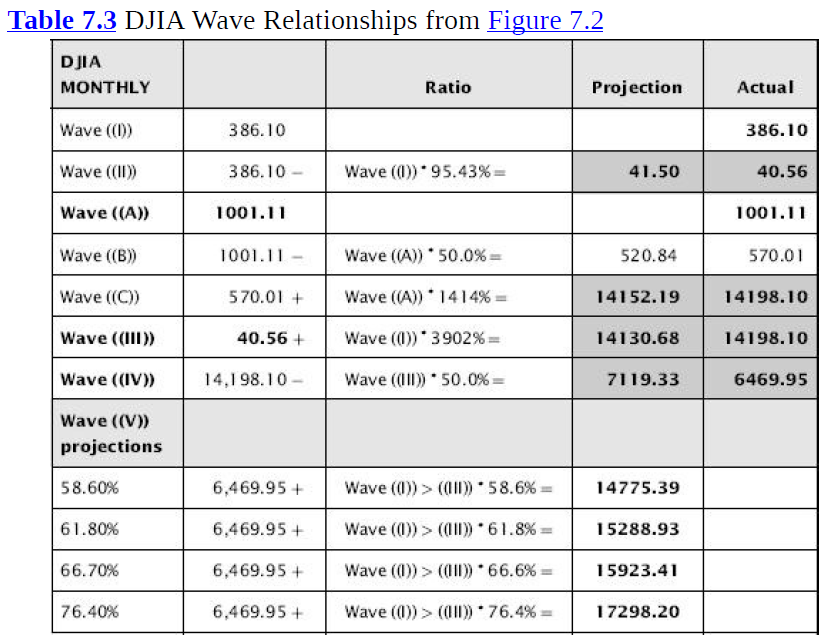
In general, the retracement ratios were similar to any other wave development, with many close to either 50% or 66.6%. Note that using the assumed starting value of 25.56 the 1930s crash retraced a steep 95.43%, and Wave ((B)) and Wave ((IV)) were both close to 50%.
However, the biggest issue with such an
extensive five-wave move was in justifying the projection ratios in the
extensions. I found it interesting that while in forex a very deep extension in
Wave (iii) could project by 290.02% or even 390.02%, in this case Wave ((III))
had extended by a multiple of 10 times this larger figure—a 3,902% projection.
What was therefore important for me to feel comfortable with in this ratio is that the intrinsic wave relationships in Wave ((A)) and Wave ((C)) should also confirm this same area. The 1,414% projection in Wave ((C)), which appears to be a 10 times multiple of 141.4%, is also unusual. This is another area that I wanted to confirm more closely.
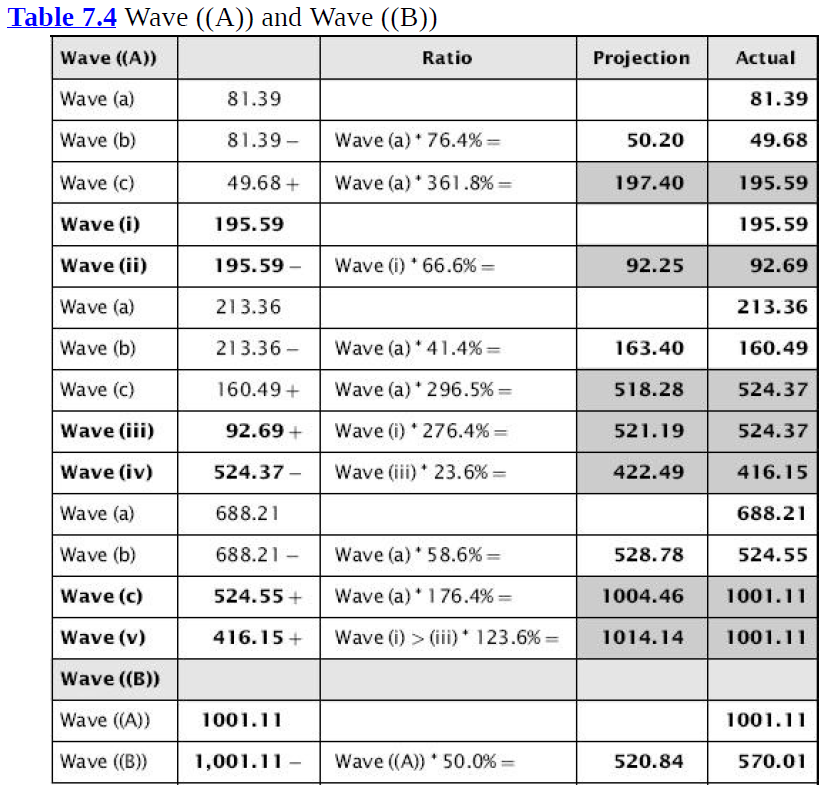
The retracement and projection ratios throughout Wave ((A)) are all very common and generated targets very close to the actual respective wave terminations. If there are any that deviated very far from the norm then the 123.6% projection in the extended Wave (v) is more than I would normally expect in forex. The retracement in Wave ((B)) was also a deviation from an exact 50%. However, this is not uncommon and does not really detract from the overall structure.
Table 7.5 shows the relationships in Wave ((C)).
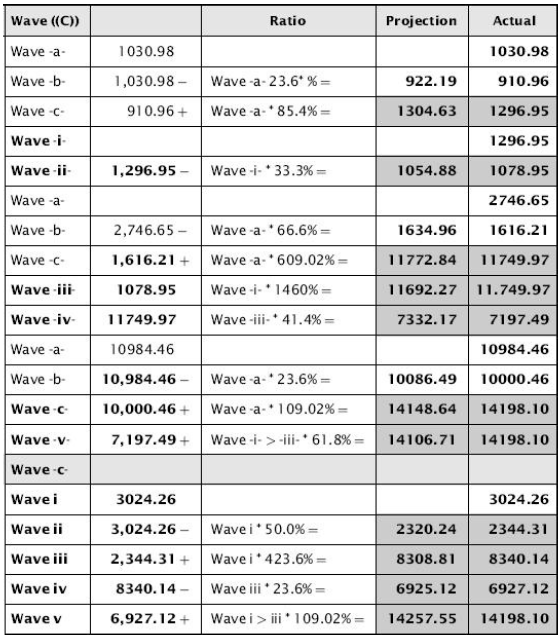
Once again the ratios are mostly very commonly
seen, with just a few exceptions. Wave -iii-and the Wave -c-projection in Wave
-iii-are really the two which stand out as being more questionable. The Wave
-c-projection of 609.02% is one I can accept as being in line with commonly
seen 109.02% ratios. The Wave -iii-of 1,460% can only be described as unusual.
While it has a link to the 14.6%, the multiple of 100 in a Wave -iii-position
is not one I would expect.
For this to be considered acceptable I need the
resultant wave ratios connected with Wave -iii-to conform more closely to
normal values. The 41.4% retracement in Wave -iv-is very common. The 61.8%
projection in Wave -v- (from the Wave -iv-corrective low) is also very common.
Equally the intrinsic ratios of the Wave -b-and Wave -c-of Wave -v-are also
common.
Therefore I consider the entire wave count from
the inception of the index to the Wave ((III)) high to have a strong chance of
being correct. That being the case, the implication is for a five-wave rally in
Wave ((a)) to around the 14,198.10 area followed by a pullback in Wave ((b))
and then Wave ((c)) to match with one of the Wave ((V)) projection targets.
This will effectively see the completion of what
will then be labeled Wave {A} of higher degree, to be followed by what may well
be an extensive Wave {B} that could indeed extend over at least two decades and
potentially more.
Harmonic Elliott Wave : Chapter 7: A Case Study in EURUSD : Tag: Elliott Wave, Forex, Fibonacci : Best trading Analysis, Best Forecasting Analysis - Monthly Chart from Inception
Elliott Wave | Forex | Fibonacci |