Progression since the Original Analysis
Elliott wave analysis, Corrective patterns, Bearish divergence
Course: [ Harmonic Elliott Wave : Chapter 7: A Case Study in EURUSD ]
Elliott Wave | Forex | Fibonacci |
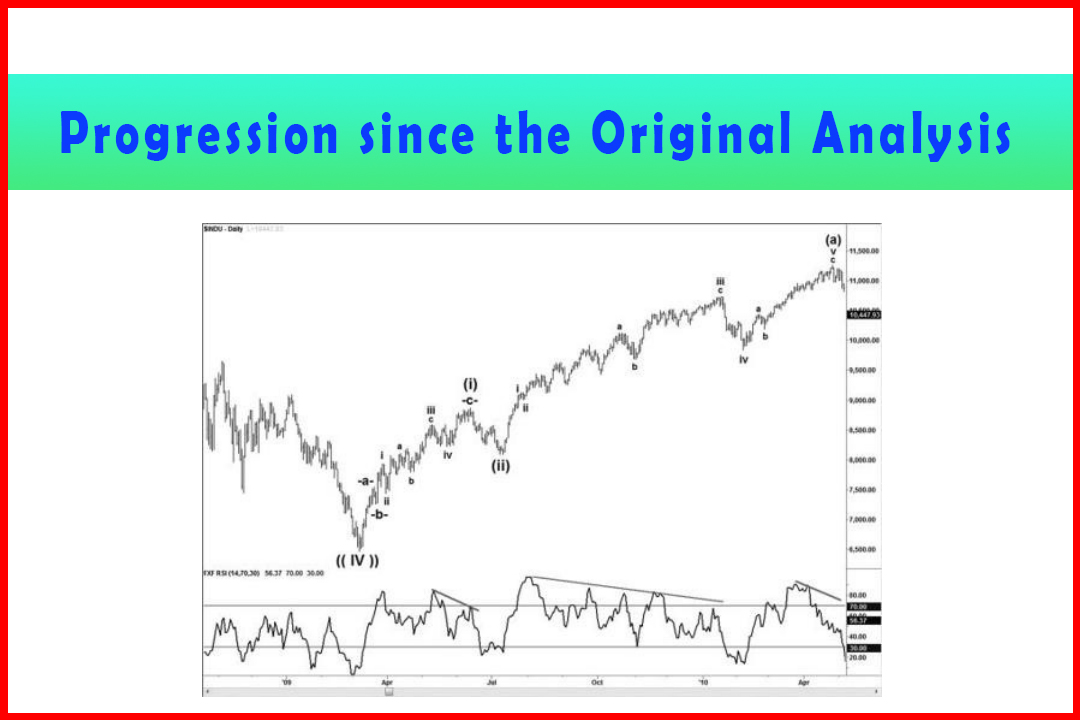
Several months have passed since I began writing this book and therefore the initial stages of the anticipated Wave (A) of Wave ((V)) have already begun to develop, and in a constructive manner.
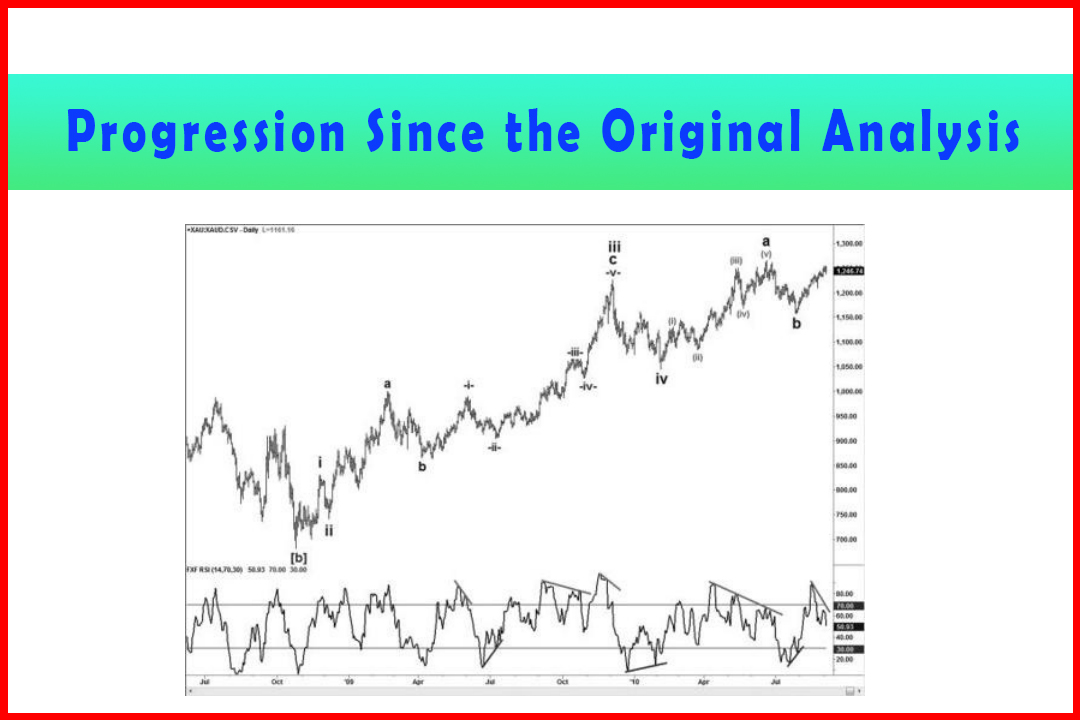
Progression since the Original Analysis
Several months have passed since I began writing
this book and therefore the initial stages of the anticipated Wave (A) of Wave
((V)) have already begun to develop, and in a constructive manner. I shall
therefore present the subsequent waves since the Wave ((IV)) low at 6,496.95. As
mentioned, the ultimate target for this first move in Wave ((V)) would normally
complete just below or just above the Wave ((III)) high. This information
should be kept in mind in order that appropriate stalling areas for each leg
are in approximately the right levels that would imply this sort of target
area.
At this stage I wasn't actively
analyzing this market and can only offer comments on the characteristics.
Indeed, it was only soon after the low that I even began to look at the chart.
At that point I had not analyzed the decline and, influenced by the general
pessimism, I had assumed that this was just a Wave (a) lower. Therefore when I
began to look at the recovery I was looking more for corrective patterns. I
finally made the analysis of the decline in the preparation for this book
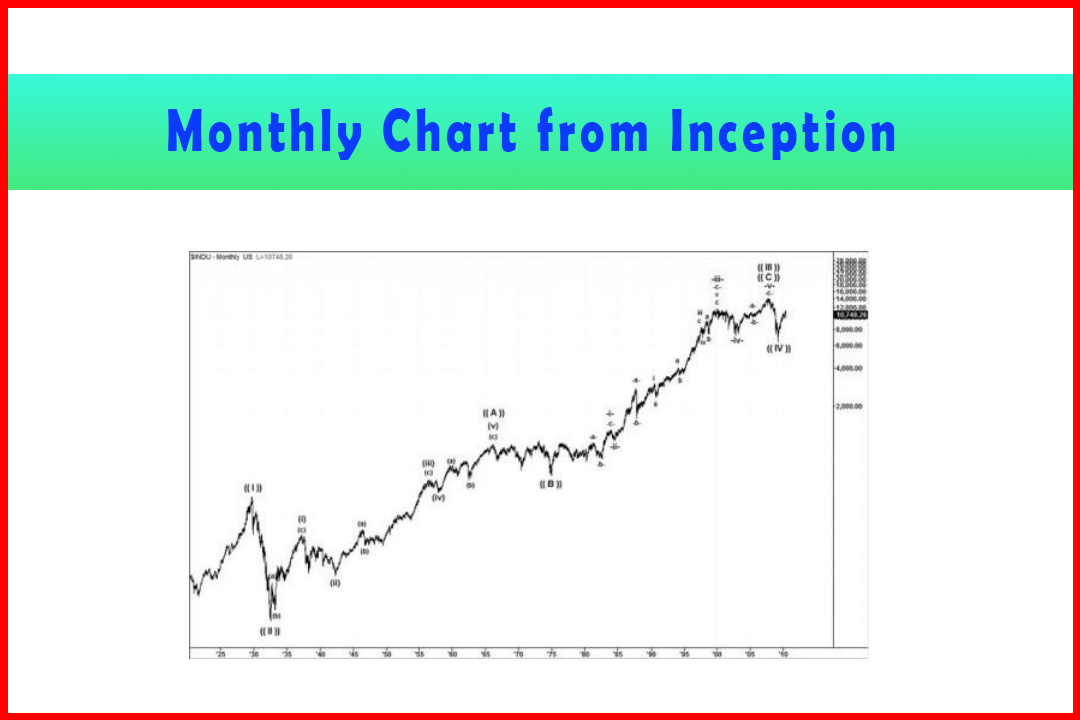
around January 2010, and was so taken aback by my findings that I decided to
obtain monthly history dating back as far as I could. This is when I first saw
the monthly chart in Figure 7.2. My first impression was that it looks exactly
like a Harmonic move, with the sweep higher following the 1930s crash
resembling a three-wave Wave ((III)). When I went through the wave
relationships I was again astounded at the projections, but could find no other
way to effectively rationalize the wave development.
Thus, it was only around the peak in Wave iii of
Wave (a) of Wave (iii) that I began to reappraise the wave structure with
bullish eyes. It was only after the peak at Wave (a) that finally I had access
to intraday data and began to observe movements more closely and formulate
targets. I shall provide that after the description of the rally to Wave (a) of
Wave (iii).
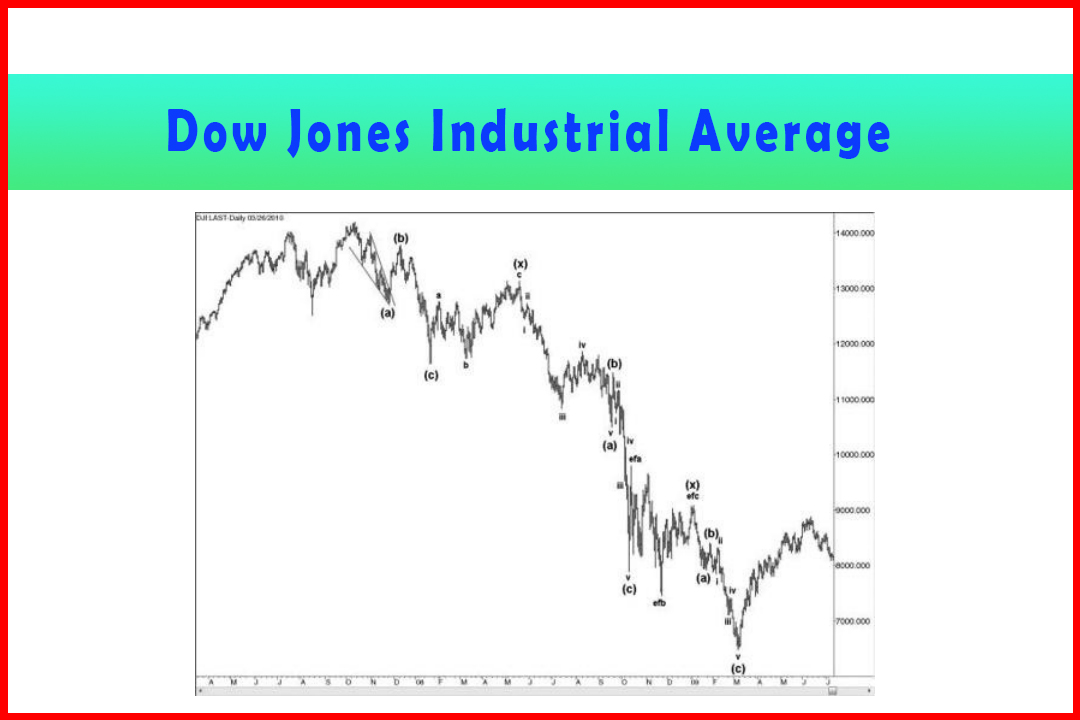
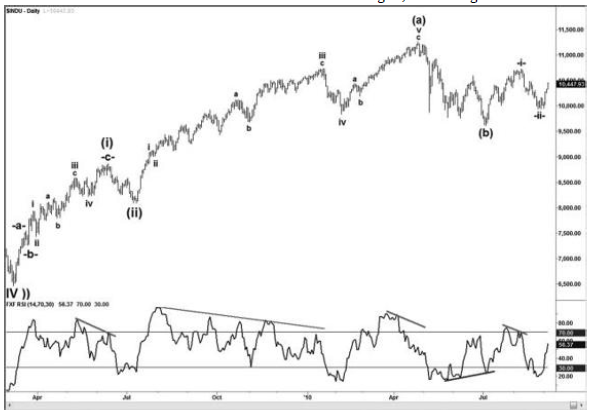
Figure 7.3 displays the initial Wave (i), Wave
(ii), and Wave (a). The initial recovery after the Wave ((IV)) low quickly
moved higher and it was quite difficult to judge from the daily chart exactly
where Wave -a-ended. At this point the focus should be on where the Wave (i) is
mostly likely going to end. The area around the last swing highs within the
decline would normally provide natural price resistance, and using momentum as
a possible indication of an exhaustion of the rally, efforts should be made to
tie up the possible Wave -a-, Wave -b-, and final Wave -c-in a manner that
would identify a target in this area. As can be seen in Figure 7.3, there was a
solid bearish divergence between the Wave iii and Wave (i) peaks.
Figure 7.3 DJIA Rally in Waves (i), (ii), and Wave (a) of Wave ((a))
The next problem would be identifying where Wave
(ii) will complete. This is probably one of the most difficult points of the
early wave structure as a Wave (ii) can retrace as little as 14.6% or as much
as 100%. It is not uncommon for the internal wave count to be erratic, causing
confusion as to whether it has completed a Double Zigzag or even a simple
Zigzag that could be followed by a Triangle, Flat, or Expanded Flat. In the
last case it can cause a defensive approach to allow for an Expanded Flat,
which delays confirmation of the resumption of the rally, which occurred in
this case where Wave (a) developed sharply. However, once the 38.2% expansion
had been overcome there could be more confidence in the analysis.
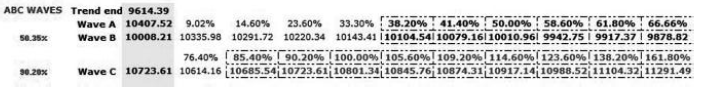
Table 7.6 displays the wave relationships for
Waves (i) and (ii) with the breakdown of the five-wave rally in Wave
-c-provided at the bottom of the table.
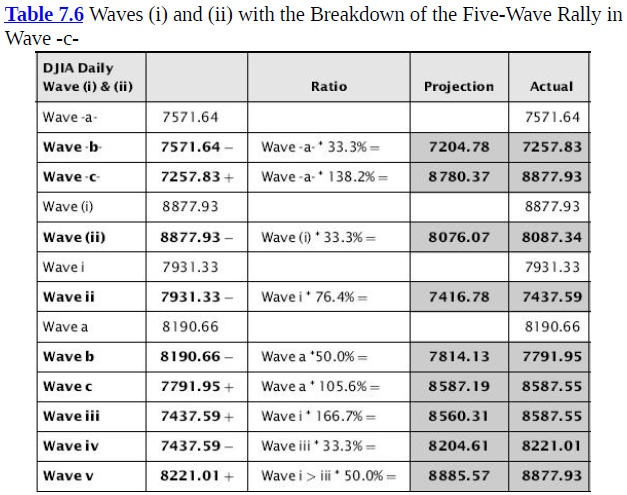
While the correction in Wave -b-was close to a
33.3% retracement, the projection in Wave -c-was more approximate, with the
final stalling point a little in excess of a 138.2% extension. These tend to be
a little disconcerting, but what made this situation provide more confidence
was the common wave relationships through the entire five-wave rally. I have
noted that compared to forex the DJIA has a tendency toward 50% projections in
Wave (v), and sometimes less. In this case the Wave v was almost exactly 50%.
Wave (ii) stalled at the 33.3% retracement, and
from there the rally resumed in a very aggressive manner. This again made the
identification of Wave i very difficult indeed. While potential targets in Wave
(iii) could be generated at this point that would slot into a subsequent Wave
(iv) and Wave (v) that would imply a final high in Wave ((a)) around the
14,198.10 high, the problem is that the Waves (a), (b), and (c) could hold any
number of ratios and thus there is no real way of working out how this would
finally develop.
Thus, the uncertainty of where Wave i actually
ended will have caused confusion for the rest of the rally. Momentum for much
of the gains was displaying a bearish divergence but none of the pullbacks
penetrated a prior swing low. This was also true of the Wave iv. Rather
ironically, the final high in Wave v and Wave (a) produced only a minor bearish
divergence. If there were any clues along the way, then the 50% retracement in
Wave b of Wave iii was one that could have provided stronger evidence that
there would be a Wave c to complete Wave iii. It would also be possible to link
the correction in Wave b and also Wave iv to a possible Wave ii low since they
both have direct relationships with Wave ii.
As I mentioned earlier, it was only from just
after the Wave iii of Wave (a) when I made the analysis of the decline from the
14,198.10 high and then the entire rally from the 1880s that I personally
started to become bullish. I can only look at the chart and feel the bullish
analysis may have been hard to follow.
After the peak of Wave iii and having analyzed
the monthly chart I became bullish. By the time the Wave (a) peak had been
confirmed I found the wave structure much clearer, and observation of the
hourly charts made the entire analysis come together. The clear conclusion was
that Wave (b) would retrace the rally from the Wave (ii) low at 8,087.34. The
rally until this point has been quite direct, so while Wave (b) can be shallow
the potential for a 50% retracement, perhaps more to 58.6% or 61.8%, was quite
possible.
As shown in Figure 7.4, the correction in Wave
(b) developed very sharply in the initial stages, eventually seeing a choppy
decline in a Triple Three to 9,614.32. The 50% retracement was at 9,672.68 and
58.6% at 9,400.00. At this point many fund managers were talking about the
200-day moving average, which was penetrated several times toward the lows, and
discussing whether the index would extend losses or recover.
Figure 7.4 Correction in Wave (b) of Wave (iii)
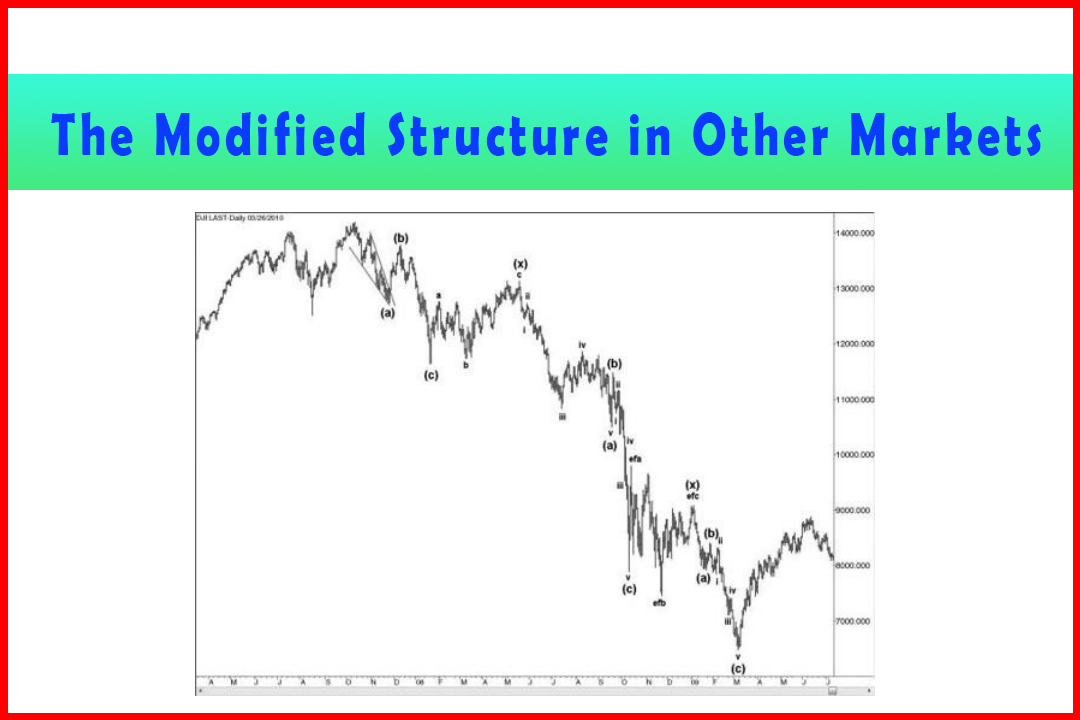
This decline had reached around 15%, which I
understand is a general rule-of- thumb to indicate a bear market and based on
the historic moves from the 1880s. Looking back at Figure 7.2, it is quite
obvious that corrections have been shallow and this will increase the potential
for deeper retracements as price moves higher. The drop to the 2009 low at
6,496.95 is ample evidence of this. I suspect the risk is we shall see deeper
retracements as we move to the final high that will repeatedly provoke
corrections of over 15% that will cause not only the rule to cause some
confusion but also see the 200-day moving average to be whipsawed on many more
occasions. Thus, around the Wave (b) low, Harmonic Elliott Wave was indicating
a recovery was due.
Figure 7.5 displays the hourly chart from the
9,614.32 Wave (b) low. According to the implied wave count there should be a
five-wave rally to new highs to reach a projection drawn from the daily Wave
(i) that should match a projection in Wave (c). Therefore the initial move
should begin with a three-wave Wave -i-.
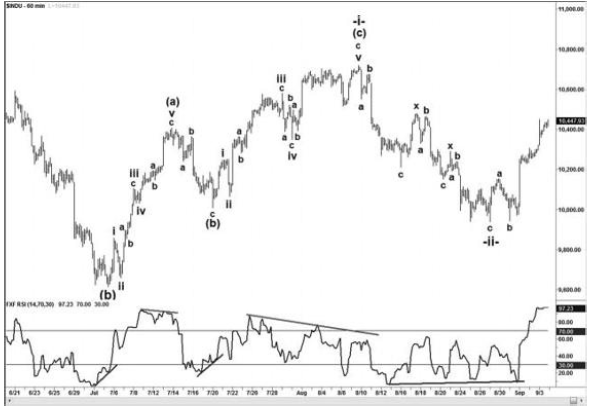
The first rally would most probably stall just below
the last Wave -b-in the decline from 11,258.01. Indeed, the Wave (a) of Wave
-i-did just that, and provoked a correction in Wave (b) that slipped just below
the previous Wave iv of Wave (a) to a 50% retracement. From there a further
five-wave rally developed that extended 90.2% of Wave (a) to complete Wave
-i-and generate a pullback in Wave -ii-that corrected between 66.7% and 76.4%.
The following tables provide the wave
relationships for each section of the entire rally and correction.
Table 7.7 shows Wave (a) and (b) of Wave -i-. All the projections were reflective of the normal ratios for each respective move, with the exception of Wave c of Wave v which extended by an unusual 141.4%, representing a harmonic extension. However, this was within 10.00 of the 76.4% projection in Wave v. The correction in Wave (b) was just about exactly 50%, with a 223.6% projection in Wave c, a ratio that doesn't occur frequently but one I have also noted in the forex market.
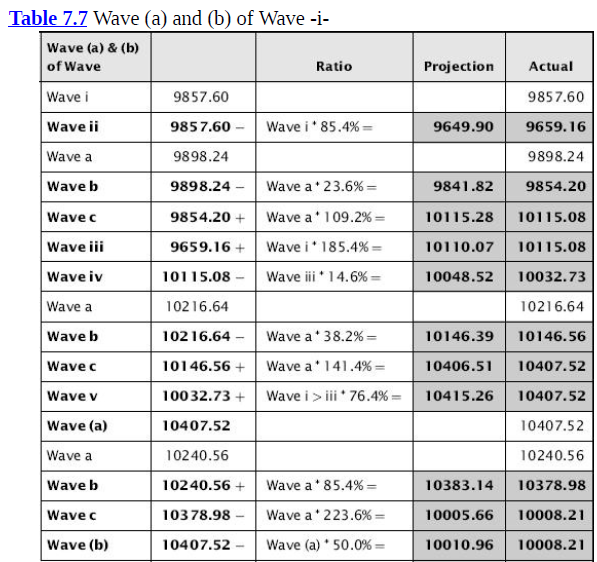
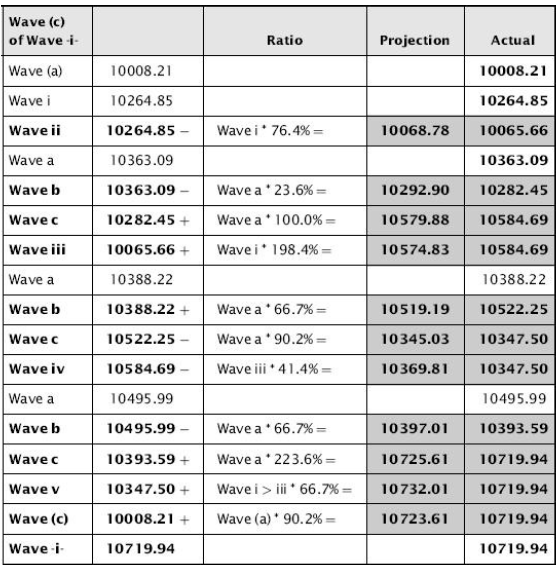
Table 7.8 shows Wave (c) of Wave -i-. The
five-wave rally in Wave (c) developed with greater correlation of projected
targets throughout, culminating in a 66.7% projection in Wave v, implying a
target 12.6 above the final stalling point which matched with the 90.2%
projection in Wave (c) after a solid bearish divergence.
Table 7.8 Wave (c) of Wave -i-
With Wave (a) and Wave (b) completed it was possible to generate projection targets in Wave (c) through my spreadsheet (shown in Figure 7.6).
Figure 7.6 Projection Targets in Wave (c)
At this point it would not be possible to know
the final stalling area, but through the development of the Wave (c) the Wave v
should provide a target close to one of these areas. This high was then Wave
-i-of the Wave (c) of one higher degree, being part of the anticipated daily
Wave (iii). Using the spreadsheet again the potential targets can be generated
(Figure 7.7).
Figure 7.7 Three Prospective Target Areas
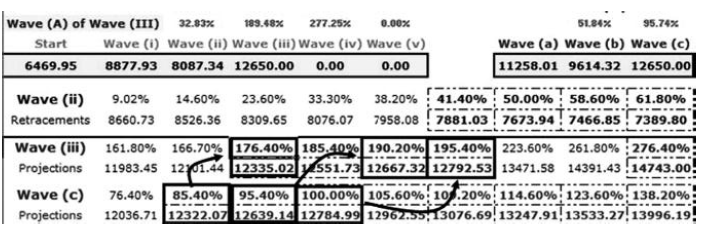
Here it can be seen that there are three
prospective target areas: at 12,322-35, being the 176.4% projection in Wave
(iii) and 85.4% projection in Wave (c); at 12,639-67, being the 190.2%
projection in Wave (iii) and 95.4% projection in Wave (c); and finally at
12,784-92, being the 195.4% projection in Wave (iii) and wave equality target
in Wave (c). Therefore, as a general target area this wave structure implies a
Wave (iii) stalling between 12,322 and 12,792.
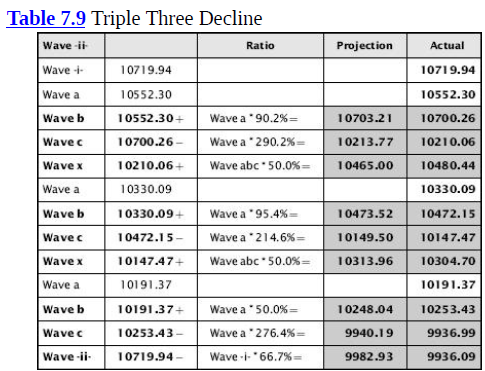
Finally, the next move to cover is that of the
Wave -ii-correction. A Wave -ii-is again one of the unknowns as it could stall
after a very short retracement or a very deep one. In this case the decline
came as a Triple Three and between the 66.7% and 76.4% retracement, as
shown in Table 7.9.
Table 7.9 Triple Three Decline
The same process of estimating where Wave
-iii-will stall may be made, bearing in mind the subsequent Wave -iv-and Wave
-v-should imply a target close to the Wave (iii) targets. Once Wave -a-of Wave
-iii-has been identified, a stronger idea of the potential projections in Wave
-iii-can be generated, followed by Wave -iv-, and through this method it will
be possible to home in on the most likely stalling point.
As a final point on this analysis it is
imperative to understand where the wave count breaks down, and compared to
Elliott's original structure it is normally much easier to identify
this with greater accuracy. For me the early break level will be the 9,614.32
low that I have marked as Wave (b) of Wave (iii), as this will imply the rally
from there to the 10,719.94 high then becomes a three-wave correction.
Harmonic Elliott Wave : Chapter 7: A Case Study in EURUSD : Tag: Elliott Wave, Forex, Fibonacci : Elliott wave analysis, Corrective patterns, Bearish divergence - Progression since the Original Analysis
Elliott Wave | Forex | Fibonacci |