Japanese Nikkei 225 Index
Equity market, Best Trading Strategy
Course: [ Harmonic Elliott Wave : Chapter 7: A Case Study in EURUSD ]
Elliott Wave | Forex | Fibonacci |
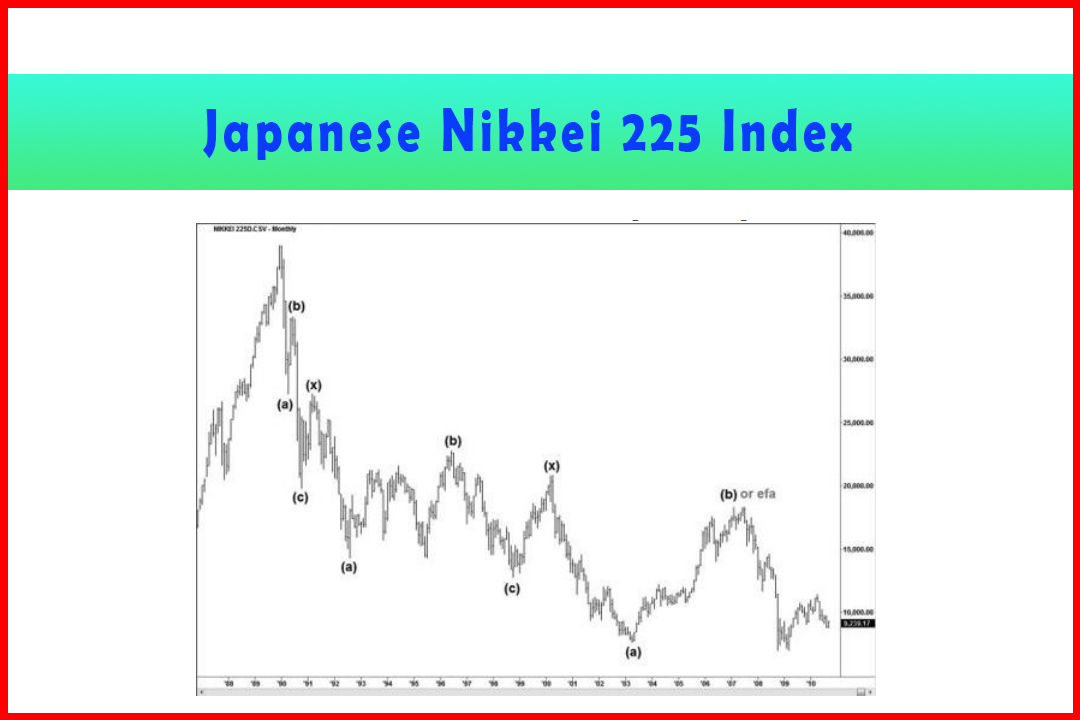
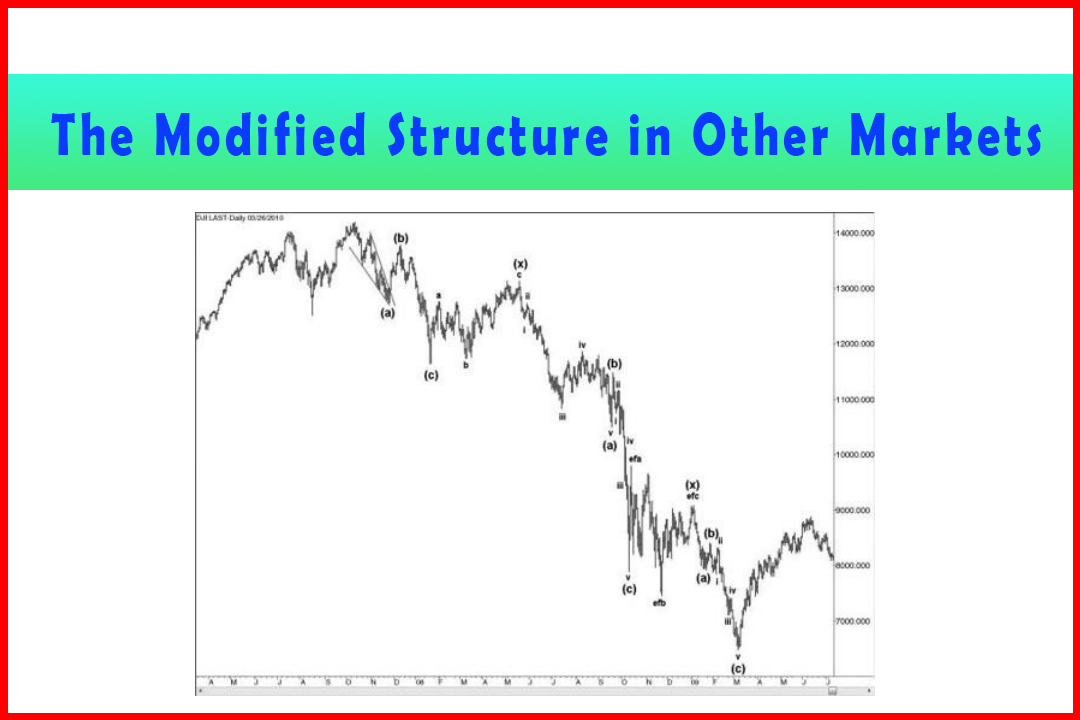
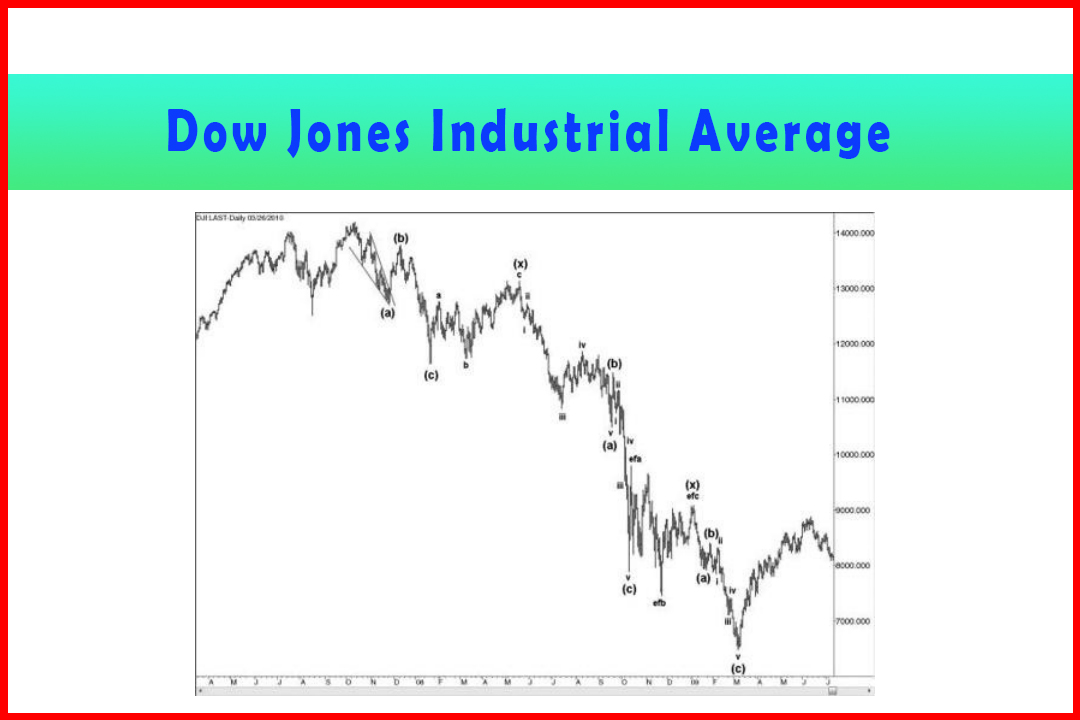
Another equity index which I thought would make for an interesting analysis is the Japanese Nikkei 225, which made its high in December 1989 and has seen a general decline from there which thus far has lasted over 20 years.
Japanese Nikkei 225 Index
Another equity index which I thought would make
for an interesting analysis is the Japanese Nikkei 225, which made its high in
December 1989 and has seen a general decline from there which thus far has
lasted over 20 years. I think we can say without too much argument that this
was a strategic high and probably also the end of a five-wave rally. Therefore
I'd like to present what looks to me to be the structure of the
decline from then.
I shall cover the initial basic moves first and
then break down the movement seen during the past 10 years in more detail to
highlight the harmonic structure.
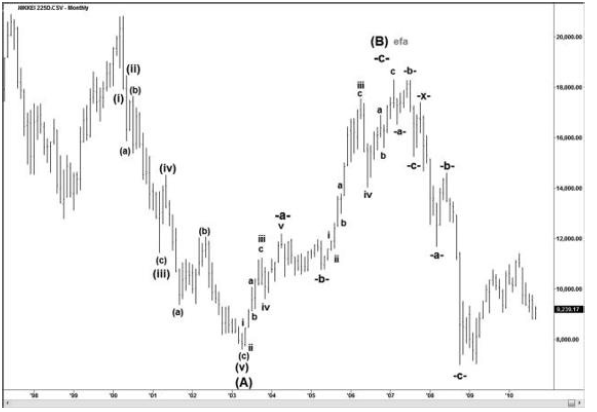
Figure 7.14 displays the monthly chart of the
Nikkei 225 Index, from which it can be seen that the structure appears to be a
Triple Three. The first two (a)(b)(c) declines are complete, while the third is
either on its final Wave (c) or alternatively the Wave (b) may be developing as
a complex correction. The first two (a)(b)(c) declines are recorded in the
following tables.
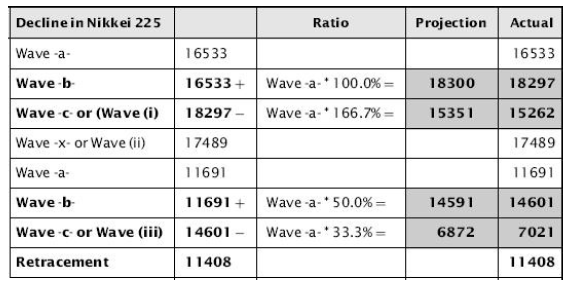
Figure 7.14 Decline in the Japanese Nikkei Index since the 1989 High
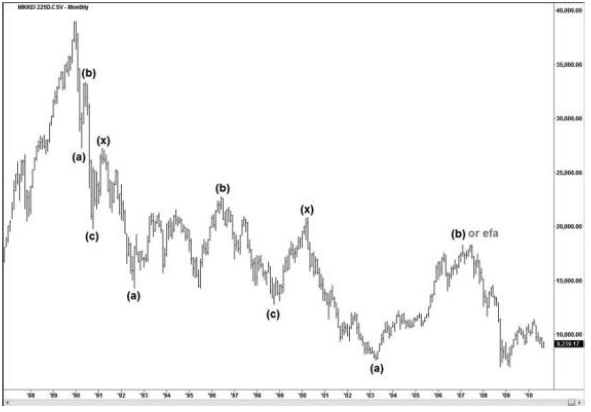
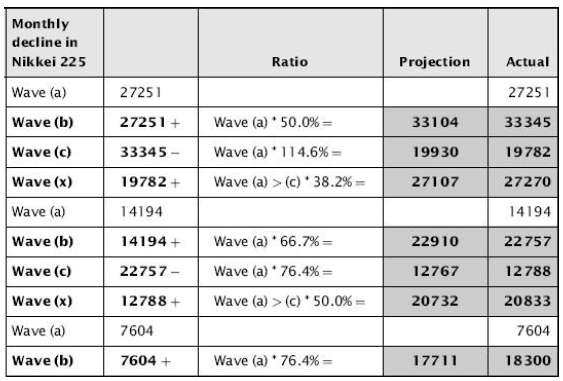
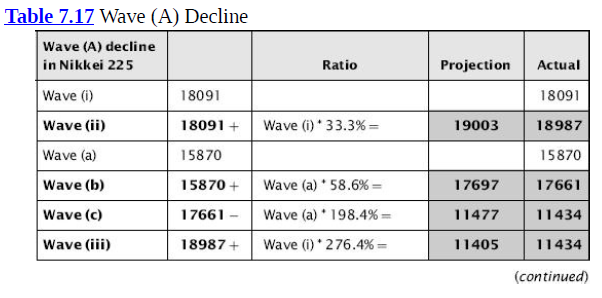
Table 7.16 displays an accuracy that sees a
variance from standard retracement and projection ratios of around 1% or less.
I therefore feel there is a strong argument for this wave count to probably
represent the correct structure.
Table 7.16 Decline in Nikkei 225
Since the third Wave (a) has already developed,
followed by a correction higher, the question of whether we are in a final
decline in Wave (c) that would generate a reversal higher, or whether this will
develop as a complex Wave (b), is very critical. I have therefore provided
these waves in more detail.
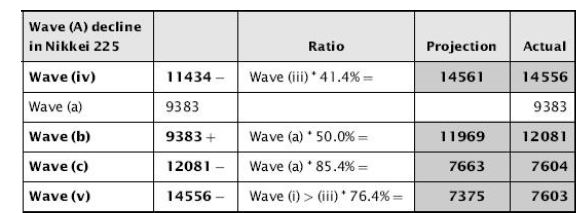
Figure 7.15 shows the five-wave harmonic decline
in Wave (A) followed by the three-wave correction. This may have completed Wave
(B) or possibly be the first wave of a complex correction. Given that the low
from the Wave (B) peak has moved below Wave (A) it may be possible to
alternatively label the Wave (B) high as Wave efa. This would imply that the
current decline is Wave efb.
Figure 7.15 Wave (A) Decline and Correction in Wave (B) or Wave efa
As can be seen from Table 7.17, the Wave (A)
decline developed with all retracement and projection ratios being common
harmonic relationships and the variance from those being extremely limited.
From that point of view, I am confident this was a valid Wave (A).
Table 7.17 Wave (A) Decline
The correction in Wave (B) developed in three waves; Table 7.18 provides the wave relationships.
Table 7.18 Wave (B) Relationships
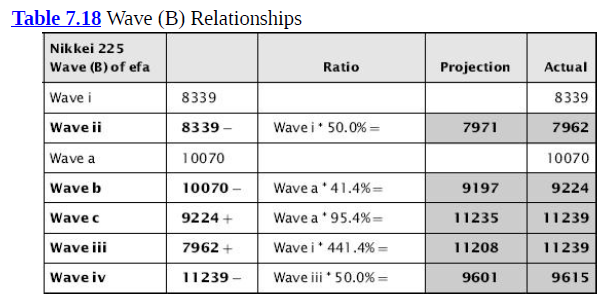

Again the majority of wave relationships are
common harmonic ratios. There are one or two more unusual ratios—for example,
the Wave iii in Wave -a-at 441.4% is not one I would normally expect to see—but
the 95.4% projection in Wave c of Wave iii is very common. In general the
levels of variance between the ideal harmonic ratios and actual stalling points
were limited.
Therefore, we have had a Wave (A) lower followed
by a deep correction in three waves that consequently raises the potential for
the Wave (B) to develop in a complex manner. To try to decide whether the
decline from there will be the final Wave (C) or whether it will be an Expanded
Flat, I have detailed the wave relationships in the decline so far (Table
7.19).
Table 7.19 Wave Relationships in the Decline So Far
It can be seen this time that to judge whether
this decline is corrective or impulsive I have added the alternative count next
to the preferred count shown in Figure 7.15. If the Wave -c-low at 7,021.00 was
actually Wave (iii), it would have implied a projection of 344.4% and the
correction from there which reached 11,408 would suggest a Wave (iv)
retracement of 41.4%. I can't say 344.4% is a projection ratio I would
expect, but there were one or two unusual projections so possibly retaining an
open mind may well be preferable.
If this turns into an Expanded Flat then ratios
we may look for would be:
14.6%
6,041
23.6%
5,078
38.2%
3,517
If an assumption is made that the correction at
11,408 was a Wave (iv) then projections in Wave (v) could be estimated at:
61.8%
4,437
66.7%
3,884
76.4%
2,790
Furthermore, the common projections in Wave (C)
can also be generated:
105.6%
4,330
109.2%
3,854
123.6%
1,949
I would suggest that if this turns out to be an
Expanded Flat then the 14.6% or 23.6% expansions at 5,078-6,041 are the most
likely. However, what is striking are the 61.8% projection in alternate Wave
(v) at 4,437 that matches closely with the 105.6% projection in Wave (C) and
the 66.7% projection in Wave (v) at 3,884 that matches closely with the 109.2%
projection in Wave (C). I am open to either alternative.
Harmonic Elliott Wave : Chapter 7: A Case Study in EURUSD : Tag: Elliott Wave, Forex, Fibonacci : Equity market, Best Trading Strategy - Japanese Nikkei 225 Index
Elliott Wave | Forex | Fibonacci |