Progression Since the Original Analysis
Elliott wave analysis, Corrective patterns, Bearish divergence
Course: [ Harmonic Elliott Wave : Chapter 7: A Case Study in EURUSD ]
Elliott Wave | Forex | Fibonacci |
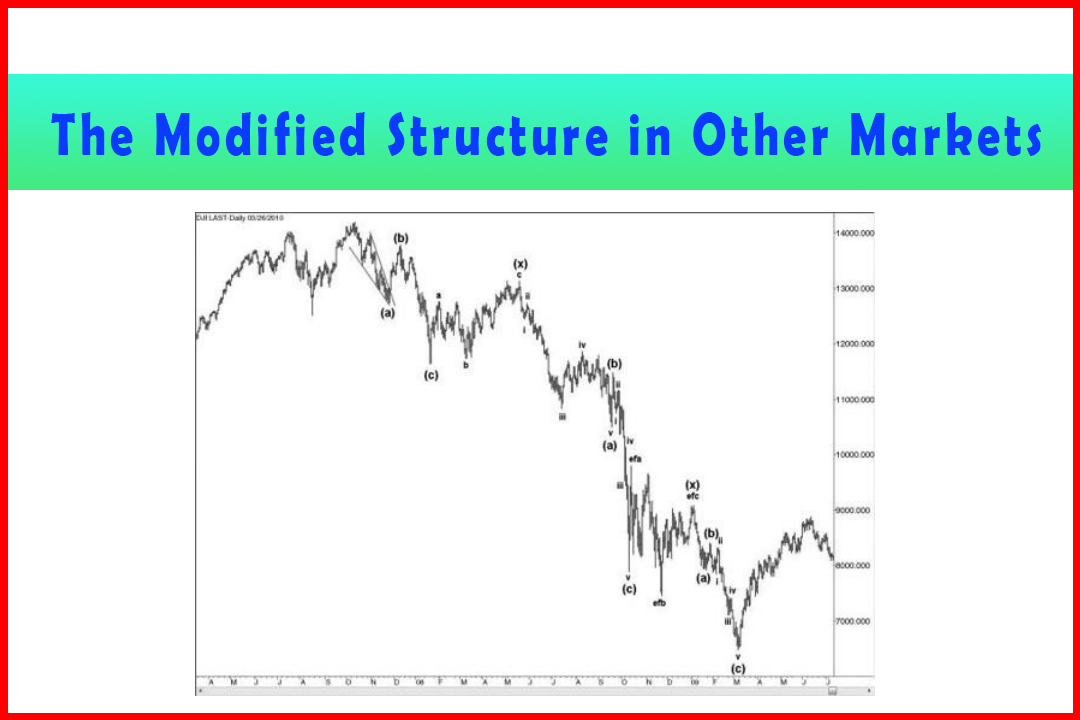
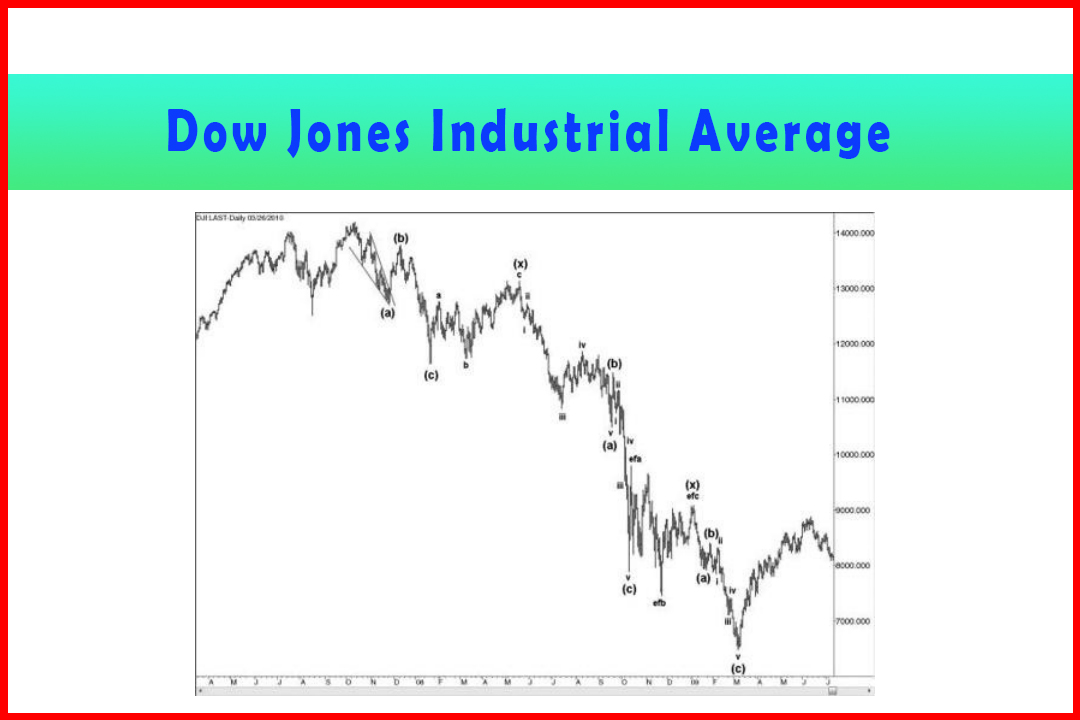
As with the analysis I originally provided for the Dow Jones Industrial Average, over the time I have been writing this book the structural development of this rally has been developing in line with the analysis.
Progression Since the Original Analysis
As with the analysis I originally provided for
the Dow Jones Industrial Average, over the time I have been writing this book
the structural development of this rally has been developing in line with the
analysis. Again, at the time of the original analysis I was working only with
daily data, but since then I have sourced the intraday data and I shall present
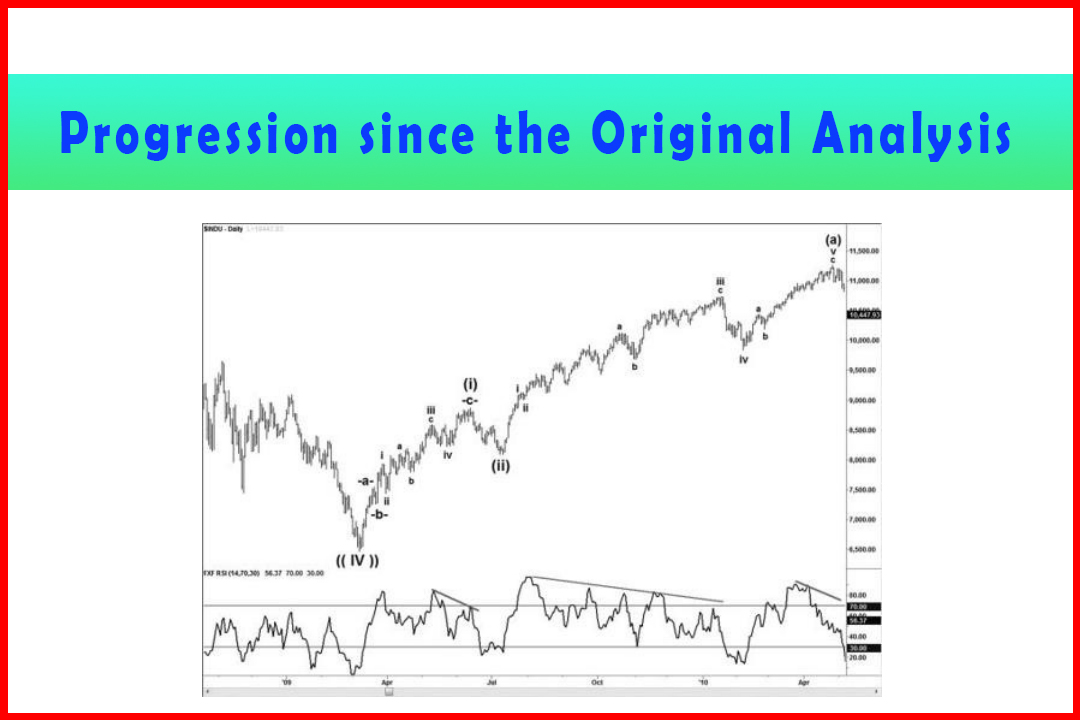
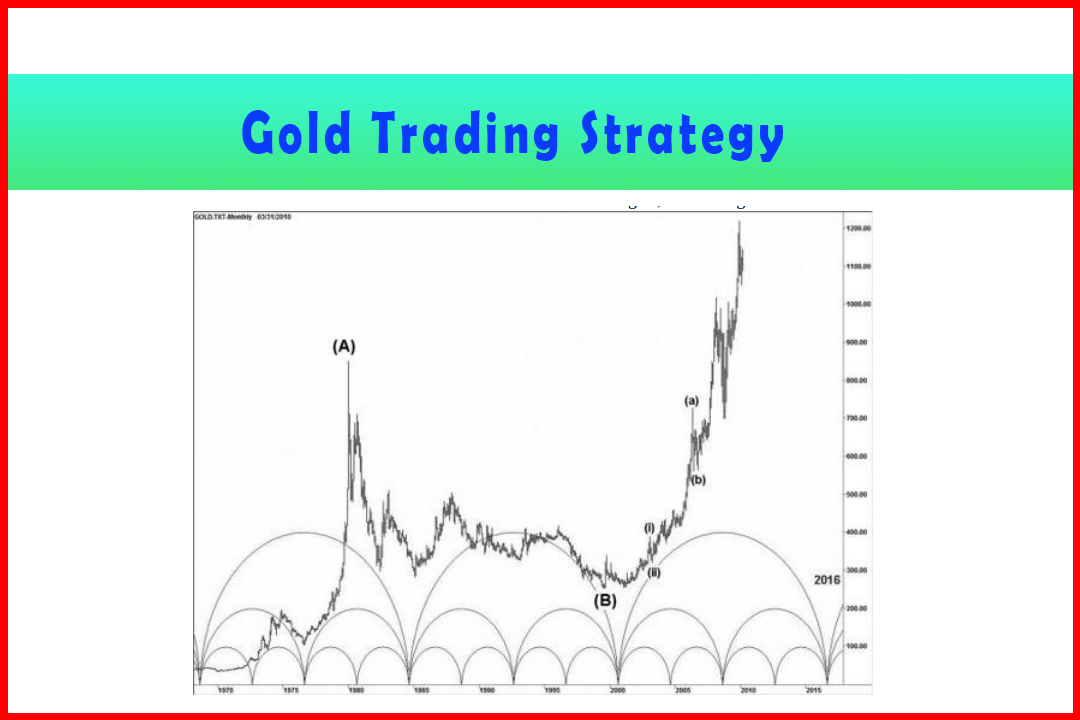
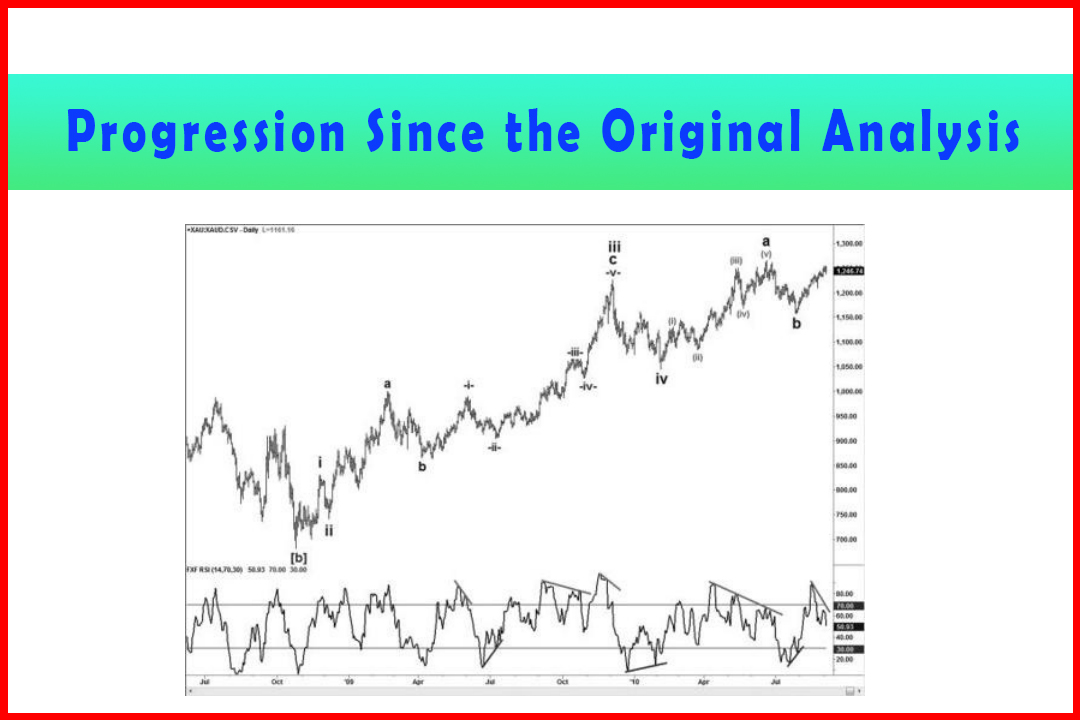
this later in this update. For now Figure 7.11 shows the progression since the
Wave iv low.
Figure 7.11 Daily Gold Displaying the Development of Wave a and Wave b of Wave v
I recall the Wave iv low shown in Figure 7.11 as
a time when many analysts were exceptionally bearish, with a common target
being around 860. I had one trader to whom I revealed my counting method
angrily berate me, declaring that I could not change Elliott's
impulsive wave structure. It seems I lost a potential subscriber as I never
heard from him again!
However, price rallied well from that Wave iv
low, initially in five waves to complete Wave a of Wave v and then a correction
in Wave b. I also noted that my RSI was quite consistent in identifying market
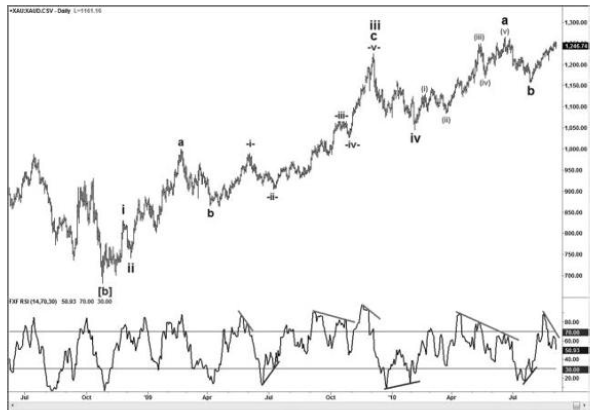
turns through bullish and bearish divergences. In Figure 7.12 I expanded the
daily chart to show the rally in Wave a and correction in Wave b more clearly.
Figure 7.12 Daily Rally in Wave a and Wave b of Wave v
In Figure 7.12 the rally in Wave a of Wave v can
be seen with more clarity. Wave (ii) developed as an Expanded Flat, following
which the normal development of Wave (iii), Wave (iv), and Wave (v) was seen.
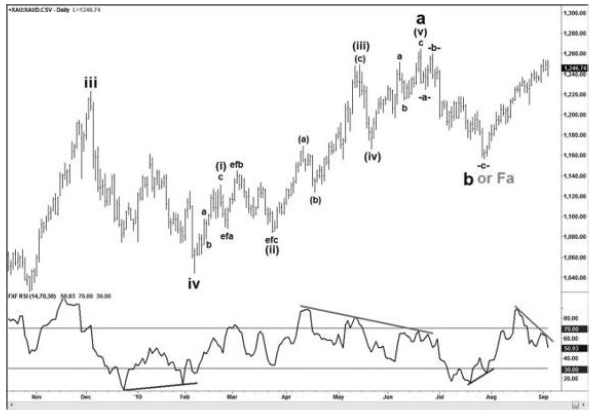
The correction in Wave b developed in three waves, and from there price has
pushed back to the 1,265 high but with a bearish divergence having developed in
my RSI. From this perspective, due to the tendency for divergences to provoke a
reversal I must allow for a (possible) Flat Wave b or even an Expanded Flat
that would imply a recycling from either the old 1,265 high or from a limited
overshoot in a Wave efb to generate a decline back to the same area around
marked Wave b or Wave Fa.
Table 7.12 provides the wave relationships in
Wave a and Wave b.
Table 7.12 Wave Relationships for Figure 7.12
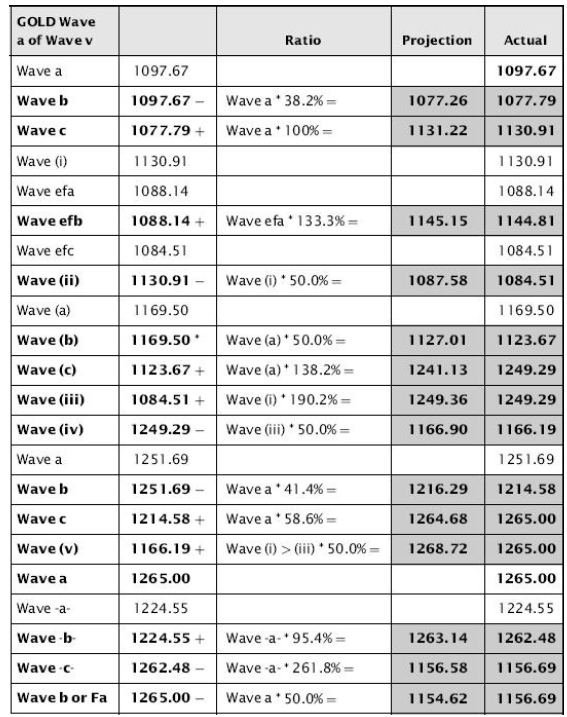
There were some very accurate retracements and
projections throughout this move, with the maximum deviation from normal
projections being around $8.00. However, the projections that certainly caught
me by surprise were the 58.6% projection in Wave c of Wave (v) and the 50%
projection in Wave (v) itself. The correction in the larger Wave b was very
close to the exact 50% retracement, and if this turns into a Flat correction,
it may well move down to test the full 50% level and perhaps a small overshoot.
In terms of the 1,390-1,395 Wave [iii] target I
highlighted in the original analysis, and using the levels of the current Wave
a and Wave b of Wave v, it is possible to see the potential projection in Wave
c:
105.6%
= 1; 389.81
109.2% = 1; 397.76
Therefore, even if Wave b develops as a Flat (or
Expanded Flat) correction that could test the 50% retracement at 1,154.62, the
109.2% projection will imply a target at around the 1,395 area and therefore I
feel we are on the right course to see this target achieved.
Harmonic Elliott Wave : Chapter 7: A Case Study in EURUSD : Tag: Elliott Wave, Forex, Fibonacci : Elliott wave analysis, Corrective patterns, Bearish divergence - Progression Since the Original Analysis
Elliott Wave | Forex | Fibonacci |